How to measure program journey performance
Last updated: June 24, 2026
The Journey and Actions tabs give you a complete picture of how your audience is moving through your program — and what's happening at each stage along the way. Use them together to understand where contacts are progressing, where they're stalling, and whether your content and CRM actions are doing their job.
These tabs live inside the Program screen. The date range you set in the program header controls all the metrics you see.
JOURNEY TAB
What it is
The Journey tab shows a live map of your program's journey — the stages, steps, and the conditions that move targets between them. Every number on the map is tied to your selected date range: audience counts, movement in and out of stages, and how many targets hit each transition condition.
It's the same visual layout as the journey builder, but in a read-only view. You can still edit the journey from here using the pencil icon next to the tab name (opens edit mode).
What you'll see
The journey renders as a horizontal series of stage columns, with steps nested inside each stage. Each stage and step shows:
Audience count — the number of targets currently at that stage or step (as of the end date of your selected range).
Delta — the net change over the selected period: audience at end date minus audience at start date. For example, "1,816 (+24)" means 1,816 targets are there now, and 24 more joined than left during the period.
Hover tooltip — hover over any count to see a breakdown: Targets in (green) shows everyone who entered; Targets left (red) shows everyone who exited.
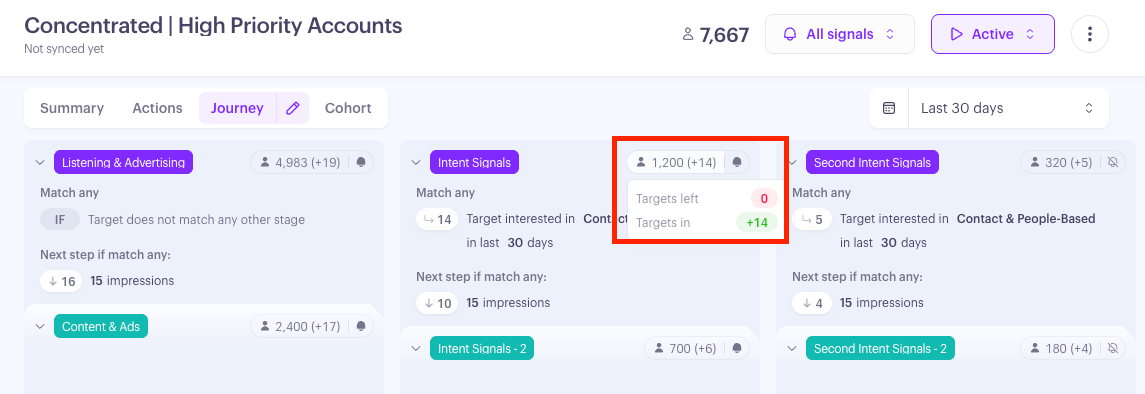
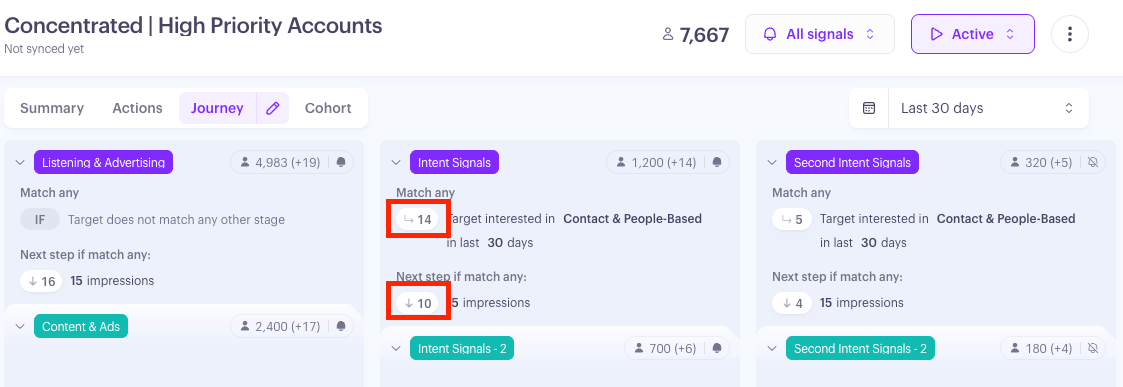
Below each stage's audience count, you'll see its entry conditions — the rules a target had to meet to enter that stage. Each condition shows its own transition count: how many targets entered the stage through that specific rule.
Understanding audience changes
Audience numbers shift for four reasons:
Cohort criteria changes — contacts added or updated in your CRM to match the cohort criteria are included automatically; contacts who no longer match are removed.
New or updated contacts — CRM syncs run approximately every 4 hours, so there's usually a short delay before newly added contacts appear.
Stage transitions — targets move between stages when they meet journey stage-entry conditions.
Step progressions — targets advance through steps within a stage when they meet sequential transition conditions.
Digging into the numbers
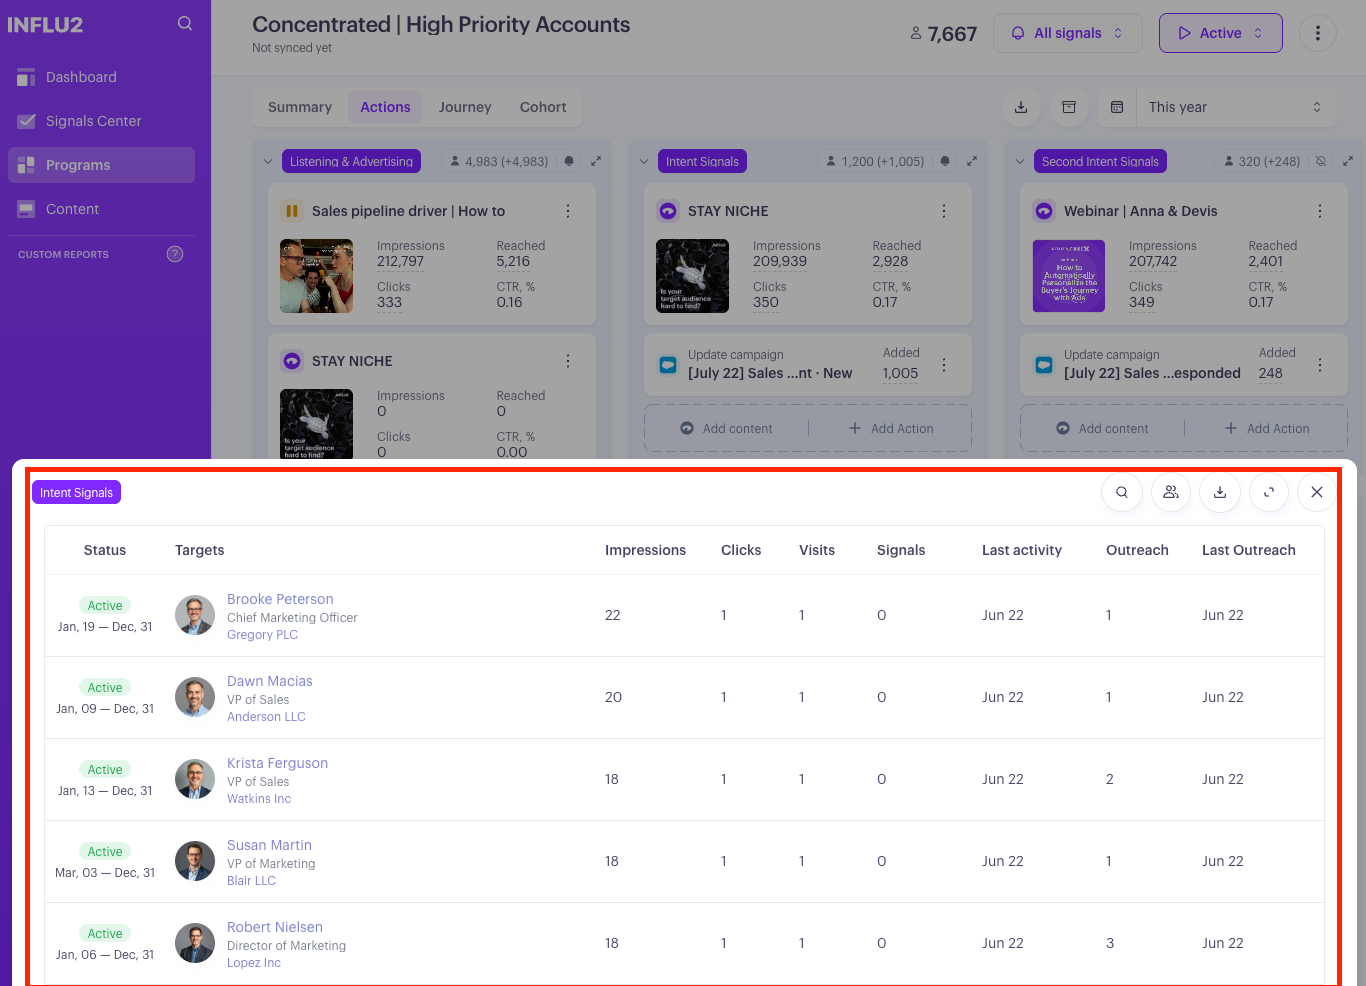
Every number on the Journey tab is clickable. Click any audience count, delta, or transition count and an Audience slide out opens, showing all the targets that make up that value. For each target, you'll see:
Name, title, and profile photo
Buying group and status
Impressions, Clicks, Visits, and Signals (within your selected date range)
Last engagement date and last outreach date
Outreach touch points (within your selected date range)
Active period (from and to dates)
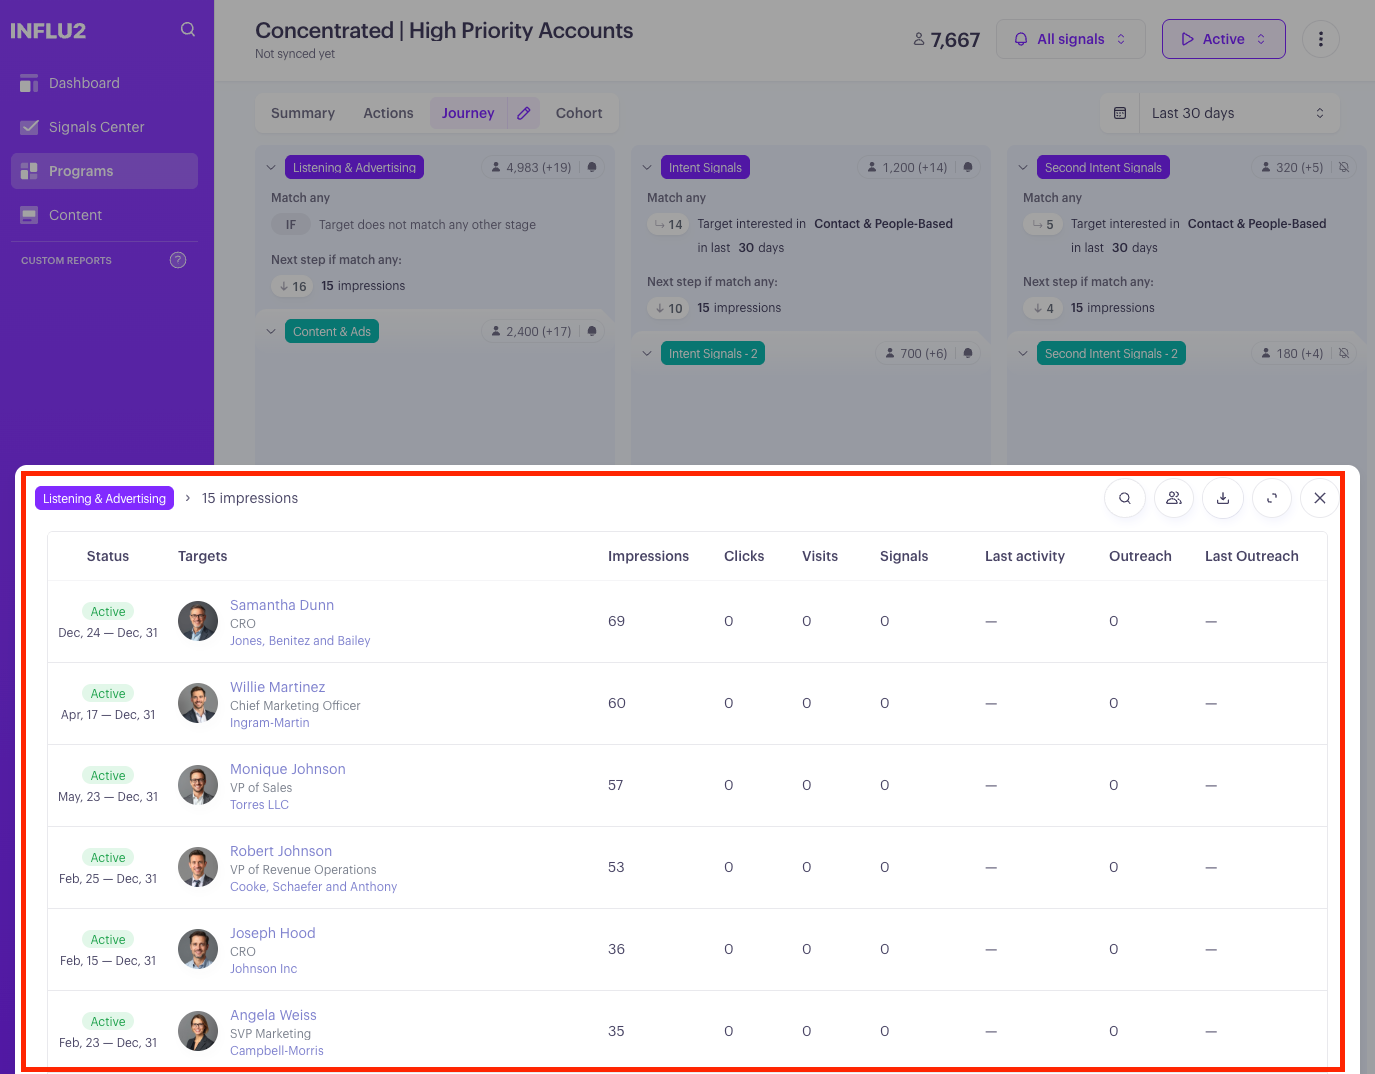
Results are sorted by most recent engagement first, then by clicks, then impressions, then alphabetically. You can export the list for external analysis.
Filters and navigation
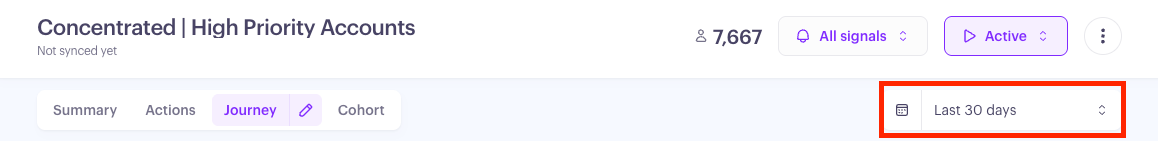
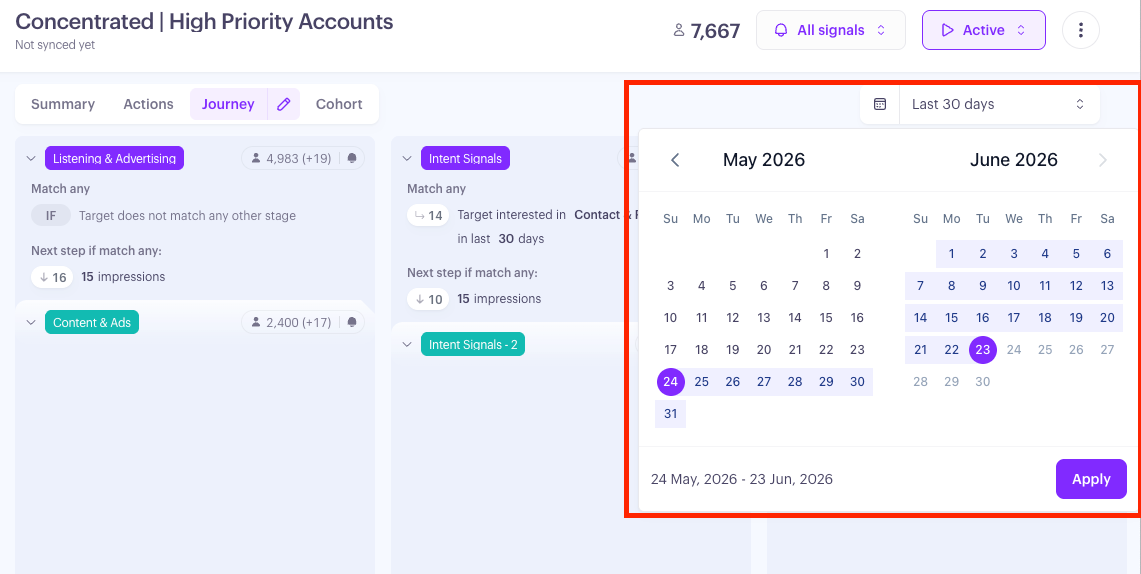
Use the date picker in the program header to set your range. Options include:
Custom Range — pick any start and end dates
Navigation buttons — move forward or backward by months
Presets — Last 7 days, Last 30 days, Last 90 days
ACTIONS TAB
What it is
The Actions tab is the board where everything running at each stage lives: ad content, and CRM/sales actions, organized by journey stage. It lets you see what's active, monitor how it's performing, and configure new activities — all in one place.
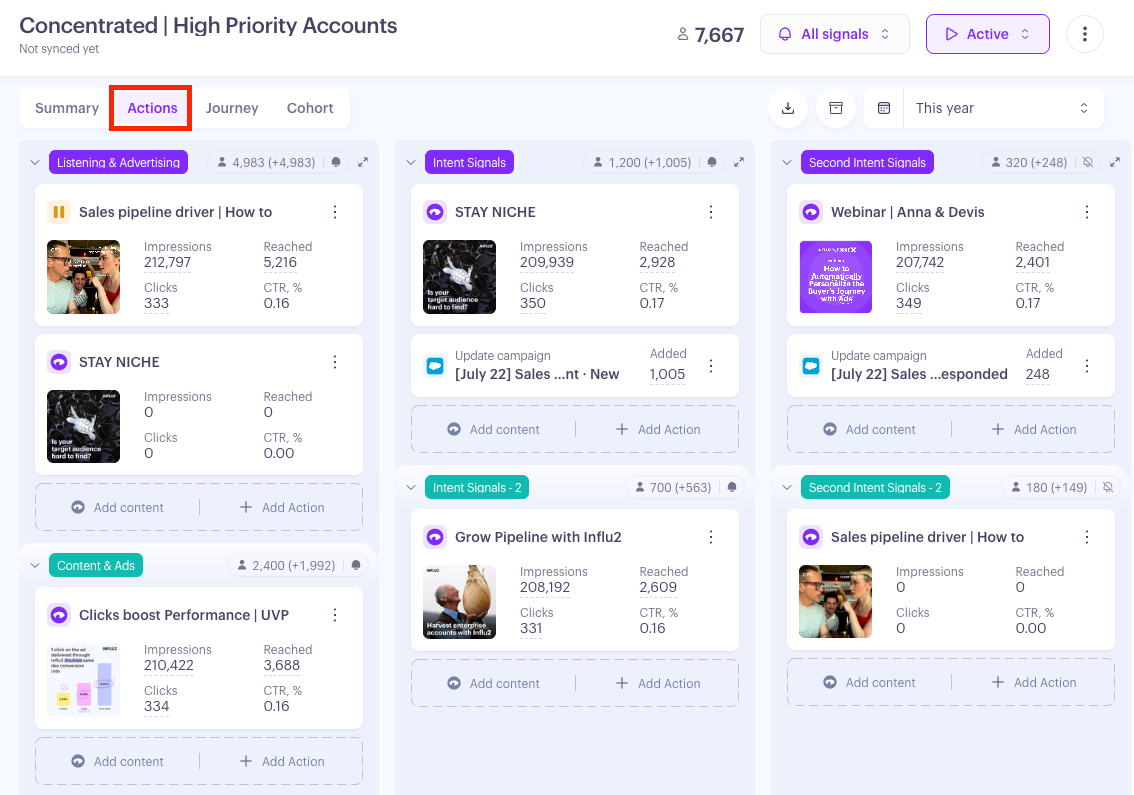
Reading the board
Columns map to your journey stages, in order. Stages can be collapsed or expanded; when expanded, content cards lay out in a grid. Steps sit inside stages with their own header. Each stage and step header shows:
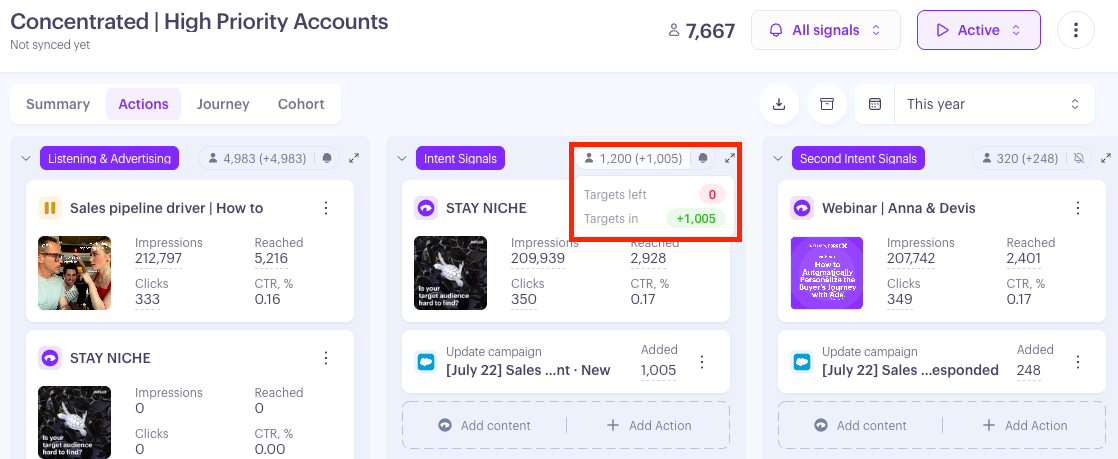
Current target count — a live snapshot of how many targets are at that stage right now (not affected by the date range).
Net change — targets that entered minus targets that left during the selected period. Hover for a breakdown of Targets in (green) and Targets left (red).
The count, Targets in, and Targets left are each independently clickable and open the Audience slide out filtered to that set.
Ad content cards
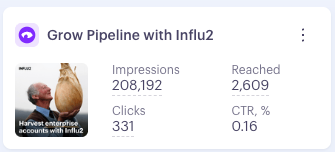
Each ad content card shows:
Content name and thumbnail (click the thumbnail to open the content page)
Stop date tag (if applicable) — shown when a stop date has been set (e.g., "Until Jun 30")
Moderation tag — shown when content is awaiting approval
4 metrics: Impressions, Reached, Clicks, CTR %
A quick guide to those metrics:
Impressions — the total number of times the content was shown to targets in the selected period. Click to see the audience behind the number.
Reached — the count of distinct targets who saw the content at least once. Click to see who.
Clicks — the total number of clicks on the content. Click to open the audience.
CTR % — clicks ÷ impressions × 100. When impressions are 0, it shows "0.00." This metric is not clickable.
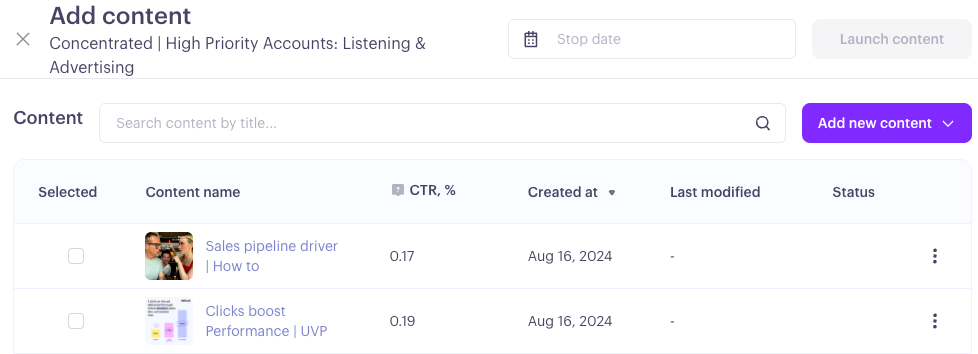
Keep in mind: Metrics are scoped to the selected date range. The CTR % shown in the "Add content" slide out is different — it's the content's lifetime rate across all campaigns, shown only after 200 impressions.
CRM and sales action cards
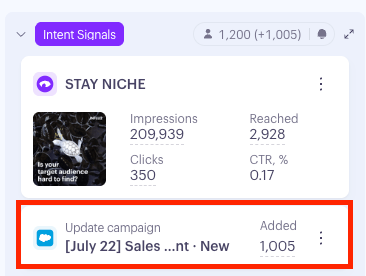
Action cards track how many times each sales or CRM action ran successfully within the selected date range. Each card shows one count with a label specific to the action type:
Update campaign (Salesforce) → Added
Add to segment (HubSpot) → Added
Remove from segment (HubSpot) → Removed
Add to cadence (Salesloft) → Enrolled
Add to sequence (Outreach) → Enrolled
Marketing hand-off → Signals
Keep in mind: These counts reflect executions, not unique targets. If a target enters the stage multiple times and the action runs each time, each execution is counted separately.
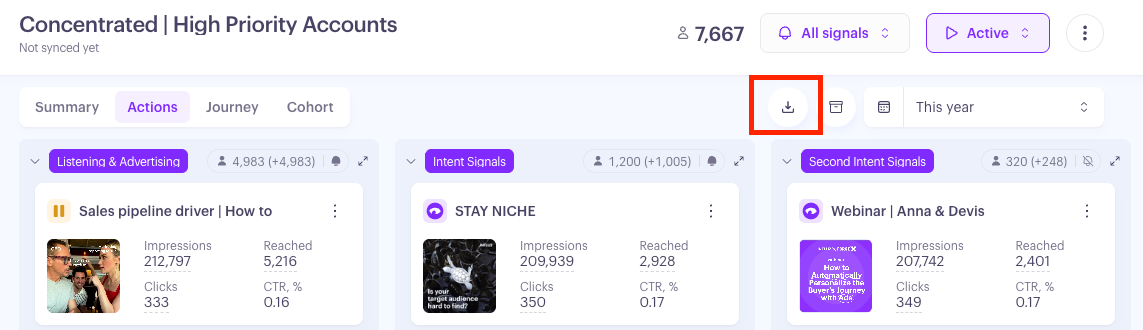
Exporting the board
Click the download icon in the tab header to export the board as an XLSX file. It includes three sheets:
Ads — each content campaign with Stage/Step, Action type, Action Details, Targets, Reach, Impressions, and Clicks
Cohorts — every stage and step with its current target count
Actions — each CRM/sales action with Stage/Step, Action type, Action Details, Success count, and Failure count