What is the Buying Group Report?
Last updated: May 29, 2026
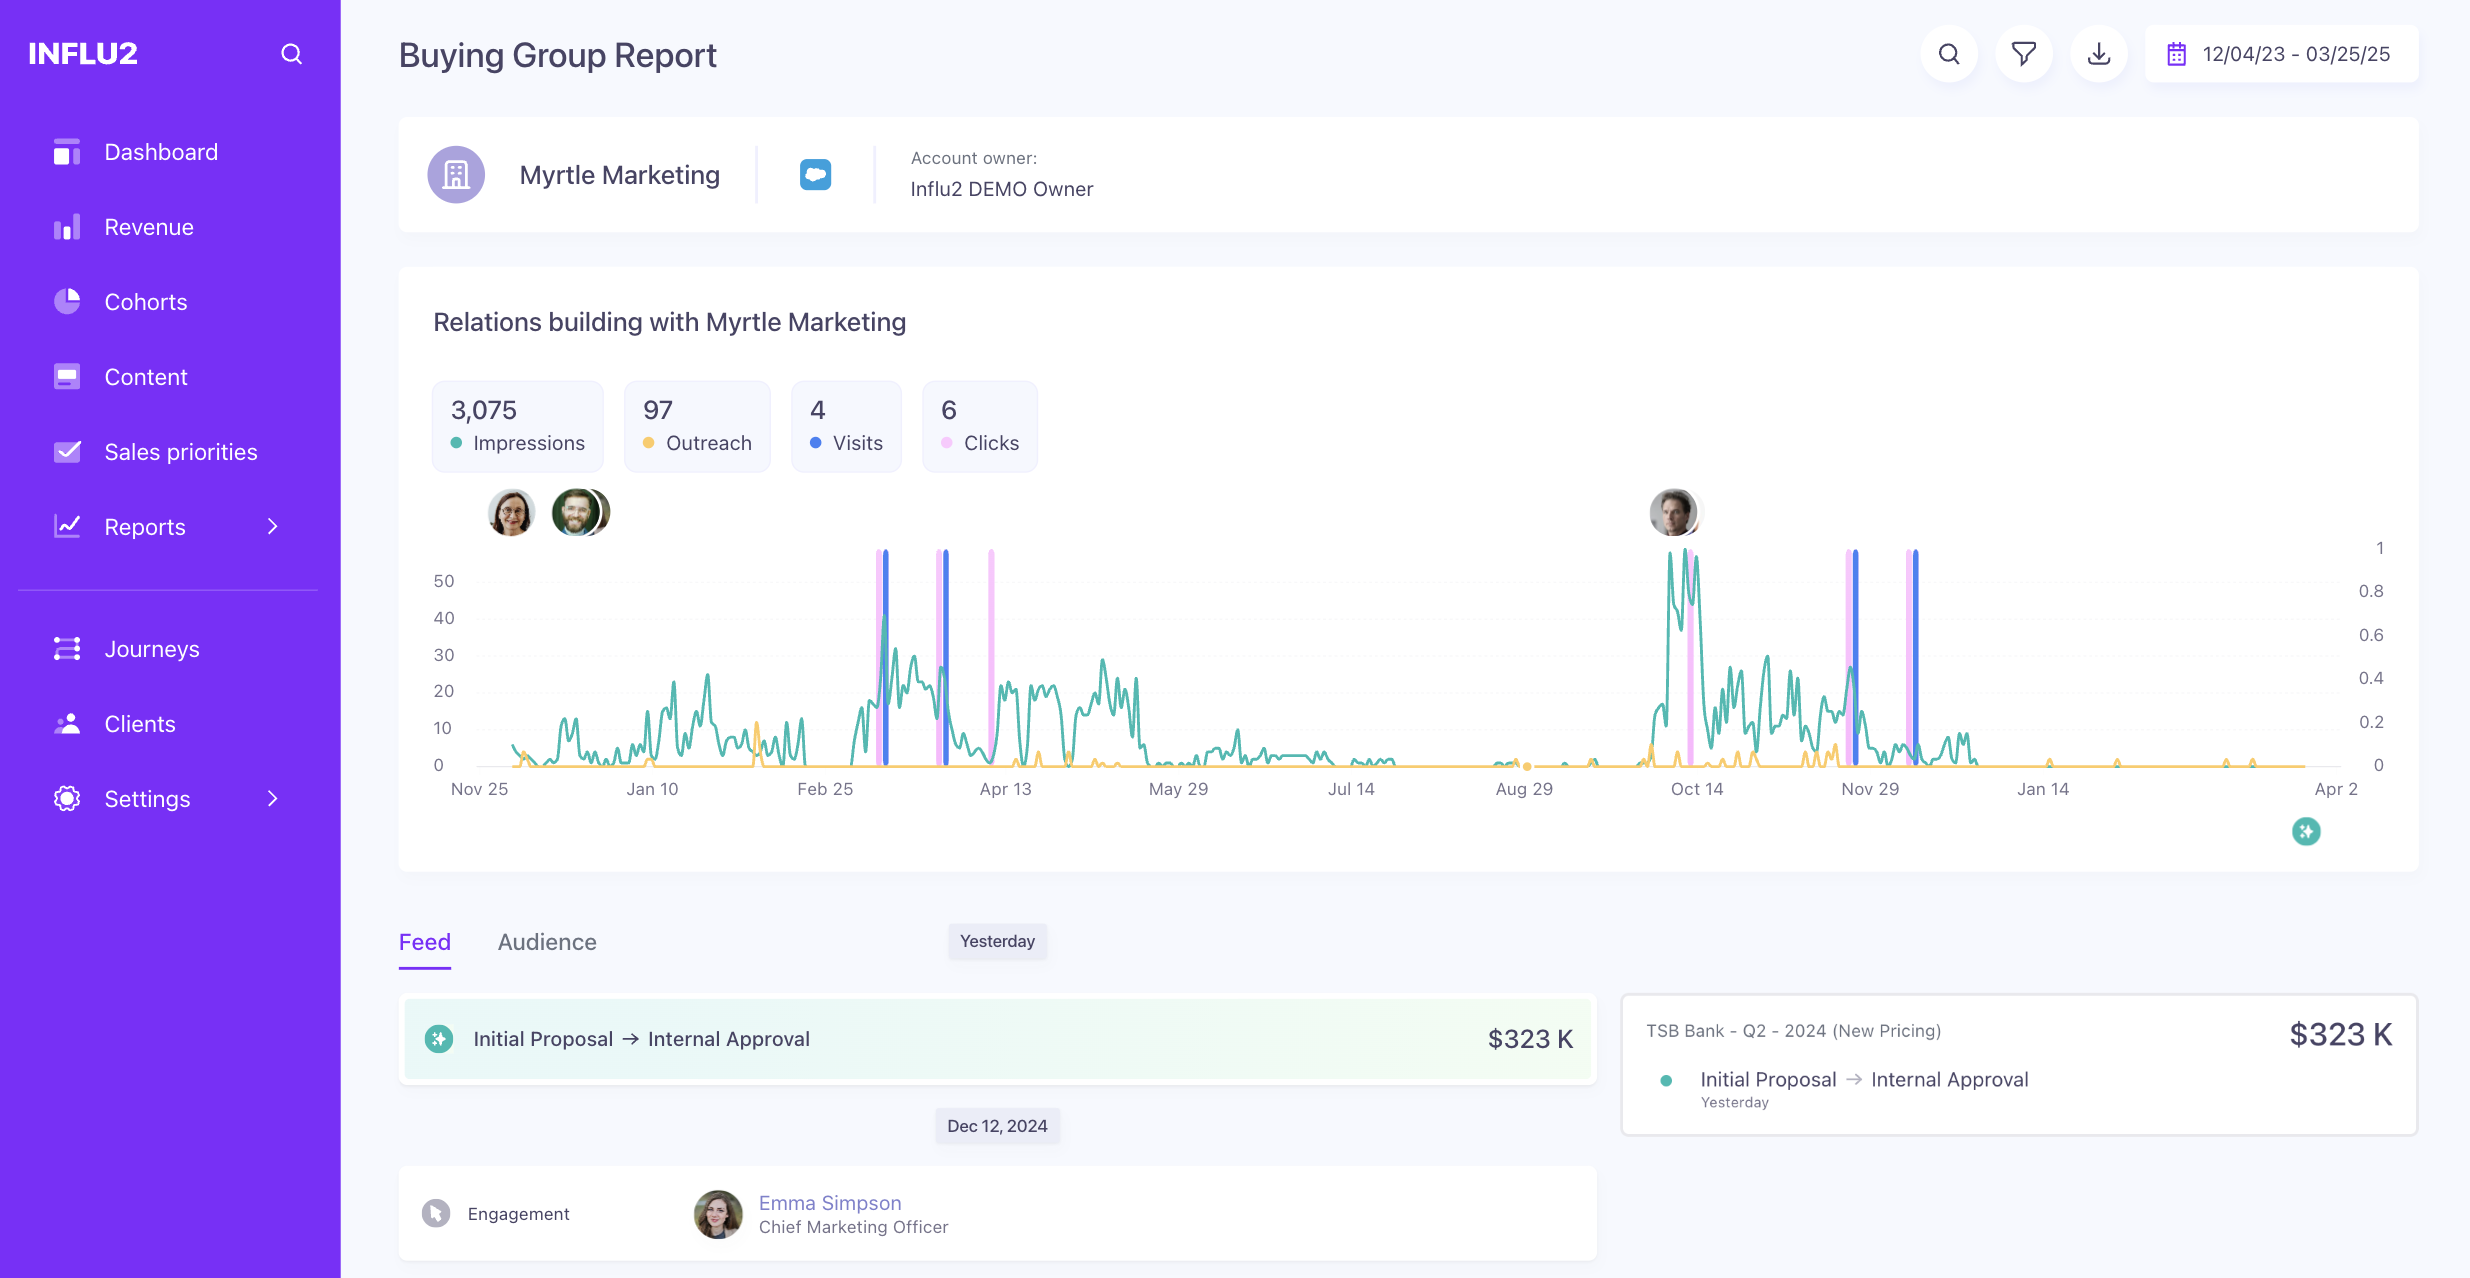
The Buying Group Report shows exactly how each buying group engaged with your ads and how that engagement contributed to generating, progressing, and winning deals. Use this report to understand your marketing influence and identify what's working.
Access the Buying Group Report
Go to the Influence Dashboard and click on any buying group name to open its report.

What the Buying Group Report shows
Buying group overview and intent
At the top of the report, you'll see:
Buying group name (click the CRM icon to view it in your CRM)
Buying Group Intent — An AI-generated summary of the last 90 days of intent signals from all members. This consolidated view helps you understand account-level interest and what topics are resonating across the group.
Use the calendar at the top to adjust the time range for any period you want to analyze.
Press the download button to export raw buying group data for deeper analysis with your team.

How you influenced the buying group
In the middle of the report, the "Relations building with Buying Group" chart shows:
Total impressions delivered to the group
Outreach activities made by your sales team
Visits to your site or content
Clicks on your ads
Hover over any contact's portrait to see details about their individual engagement.

The report also lists associated buying group members alongside their signal activity. This gives you context about broader account activity and shows you that multiple stakeholders are engaged with your content. Recent signals from team members in the last 3 months display with distinct visual treatment.

The timeline also surfaces website visits and marketing activities alongside ad engagement — so you can see the full picture of how each buying group member is interacting with your brand. You'll see:
Website visit — Visited {URL}, or Visited {URL} + N more if a member viewed multiple pages (hover to see every URL). Sources include HubSpot-tracked visits, third-party de-anonymized visits, and Influ2 direct visits — all grouped together.
Form submission — Submitted form {Form name}. Synced from HubSpot.
Email open — Opened email {Email subject} (multiple opens of the same email are grouped, e.g. Opened email {Email subject} 3 times). Synced from HubSpot.
Email click — Clicked email {Email subject} (grouped the same way as opens). Synced from HubSpot.
Event registration — Registered for event {Event name}. Synced from HubSpot.
Event attendance — Attended event {Event name}. If a member both registered and attended on the same day, only the attendance entry shows. Synced from HubSpot.
.png")
Keep in mind: these timeline activities are shown in grey because they aren't directly influenced by your ads — they're context. Yellow, green, and purple coloring is still reserved for ad engagement tied to opportunity influence.
How your influence led to deals
On the right side of the report, you'll see any opportunities associated with the buying group, with color coding showing your influence:
Yellow — Influenced deal generation
Green — Influenced deal progression
Purple — Influenced deal won

Click any stage to filter the report and see which contacts influenced that opportunity.

Use actions to see engagement
Clicked — The contact engaged by clicking an ad.
Grey: Engagement but no opportunity influence
Green or Yellow: Engagement that influenced opportunity generation or progression

Viewed ads — The contact saw your ad at least 15 times.
Grey: Views but no opportunity influence
Green or Yellow: Views that influenced opportunity generation or progression

Use opportunity activities to track influence
Meeting booked — Your team booked a meeting with this buying group. If recent engagements are yellow, your ads influenced it.

Opportunity created — A new opportunity opened. If recent engagements are yellow, your ads influenced its creation.

Opportunity progression — The deal moved to a higher stage. If recent engagements are green, your ads influenced the progression.

Opportunity Won — The deal closed. If recent engagements are purple, your ads contributed to this win.

Aggregated buying group insights
Switch to the Audience tab (next to Feed) to see all contacts you've targeted within the buying group. Identify which contacts engaged the most:
First name, Last name, Title
Total impressions, Clicks, Outreach activities, Last outreach date (within your selected time range)
Ad Visits — the number of site visits a member made after engaging with one of your ads in the selected time. Use this to separate passive ad views from active site engagement and see who's actually showing up after seeing your campaigns.
Signals — the total intent signals detected for the member in the selected time, including search intent, content intent, social posts, and website visits. A high signal count flags contacts to prioritize for outreach.
Last activity — the date of the member's most recent signal or marketing activity. A useful early warning when an engaged account starts going quiet.
Click any contact's name to open their Target Report for deeper analysis.

Key takeaway
The Buying Group Report reveals your influence at both the account and contact level. Use it to see what campaigns drive engagement, which buying group members are most responsive, and how your ads contribute to real revenue outcomes.