Within a Program: Understanding the Summary Tab
Last updated: July 14, 2026
The Summary tab is your program dashboard. It shows you who's in your program, how they're engaging, and where to focus — all in one view. When you open a Program, this is where you land.
The date range picker
In the top right, a date range picker controls every metric on the page. Change it and all the scorecards and the Audience table update instantly.

Keep in mind: The date range affects scorecards and the Audience table, but not the program audience count in the header — that always shows who's in your program right now, regardless of the selected period. That's why the Total audience scorecard and the header count can differ.
Scorecards
Each scorecard shows a key metric for your selected date range. Here's what each one means — and what to do with it.
Total audience: The number of unique targets currently in your program. This is your program size, so if it's smaller than expected, check your audience configuration in the Cohort tab.
Reach: The number of unique targets reached with ads vs. your limit. Watch this as your program runs. If you're approaching your limit and want to continue this program, increase your limit before you hit it.
Impressions: The total number of ad impressions served across all targets in the selected period. This is your volume indicator. If you have high impressions with low engagement (see Ad engagements), it may mean your message needs refinement.
Ad engagements: The total number of ad clicks and visits across your targets. This indicates how well your program overall is performing.
Job changes: The total count of job change signals detected for your targets. A high job change rate means the buying committee is shifting — new people in key roles may need to be brought into targeting.
Marketing activities: Total count of synced HubSpot activities (forms submitted, events attended, emails opened, etc.). This shows engagement happening outside your ads. High marketing activity alongside high ad engagement is a strong buying signal.
Outreach activities: The total number of outreach touchpoints your sales team has logged against targets in this program. This shows how actively sales is working this program. Low outreach with high engagement can indicate an alignment gap.
Signals carousel: Arrows let you cycle through four intent signal types: Social Posts, Search Intent, Content Intent, and Website Visits — showing counts for each. Website visit counts include visits captured by Website Visitor Identification as well as HubSpot-tracked visits.

Dive into any scorecard
Click into the number in any scorecard to see a filtered view of the targets contributing to that metric. Use this to see exactly which contacts are driving your job changes, outreach activities, signal counts. etc.

The filtered view that opens uses the same columns as the Targets view of the Audience table (described below), so you can quickly inspect status, signals, and engagement for the targets behind the metric.
The Audience table
Below the scorecards is a table showing all your targets. Three controls sit at the top of the Audience table:
Search — filter the table by target name or company.
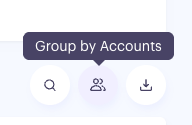
Group by Accounts — toggles between the Targets view (default) and the Buying Groups view.
Export — downloads a CSV of the view you're currently looking at.

Within the Audience table, you’ll see the following labels:
Status — A badge showing whether the target is Active or Deactivated, along with the active period dates (for example, "Sep 1 — Now"). Scan deactivated rows when you're trying to understand churn out of your program. If you see the same reason repeating, that may be a signal to revisit your cohort setup or CRM hygiene.
Active — the target is currently in the program and counting toward your audience total.
Deactivated — the target was removed from the program. The most common reasons are: the target no longer matches your cohort criteria, matched an exclusion cohort, was removed from the source list, was deleted or merged in your CRM, or was manually removed.
Keep in mind: On the Summary tab you'll only see Active and Deactivated. On the Journey and Cohort tabs you'll also see Moved — meaning the target shifted to a different stage but is still in the program.
Targets — The target's photo, name (links to their Target Report), job title, and company (links to the Account Report).
Some rows show an Unassigned label next to the target's name. This means none of the target's signals in the last 30 days have an assigned follower — so no one on your sales team is currently being notified about their activity. Worth assigning a follower so the signal actually gets routed.
Impressions / Clicks / Visits — Per-target totals for the selected date range. Use these together: high impressions with low clicks usually means the creative isn't landing for that target.
Signals — The total signal count for the target, plus icons for each signal type present. Only signal types with at least one signal show as icons (ordered by count, most active first). Hover or click for a full popover that shows every signal type — including ones with zero — with their counts.
Last activity — The date of the most recent signal, click, or visit from this target. A quick way to spot targets going cold — or just heating up.
Outreach — Total outreach touchpoints logged by your sales team for this target. Pair this with engagement to find under-served, high-engagement targets where sales follow-up is missing.
Last Outreach — The date of the most recent outreach to this target. Click any column header to sort by that column (ascending or descending). The table shows 10 targets per page by default — adjustable in the pagination controls at the bottom. If a target has no data for a metric, the cell shows 0 or a dash, and the row still appears.
Buying Groups view
Toggle Group by Accounts to switch. This organizes targets by account (buying group). Expand any account row to see individual contacts underneath.
Columns at the account level:
Buying Group — account name with link, expandable
Reach — contacts reached / total contacts in program for this account
Impressions / Clicks / Visits — aggregated for the account
Signals — total count across all contacts in the account, with icons. Hover to see all signal types
Last engagement — most recent engagement across any contact in the account
Last outreach — most recent sales outreach for the account
Outreach touchpoints — total outreach across all contacts in the account
Export to CSV captures all of the above.