There are four types of reports you can access: campaign, account, personal, and creative reports. See below for a walk through of accessing each of the reports.
Campaign reports
Campaign reports show a performance overview of a specific campaign. Let's go over what a campaign report looks like.
1. Go to your 'Campaigns' tab. From here, you can see an overview of every campaign you've made. To learn more about this page, please read 'Navigating through Influ2'. After going to your campaigns tab, select the name of a campaign you'd like to dig deeper into.
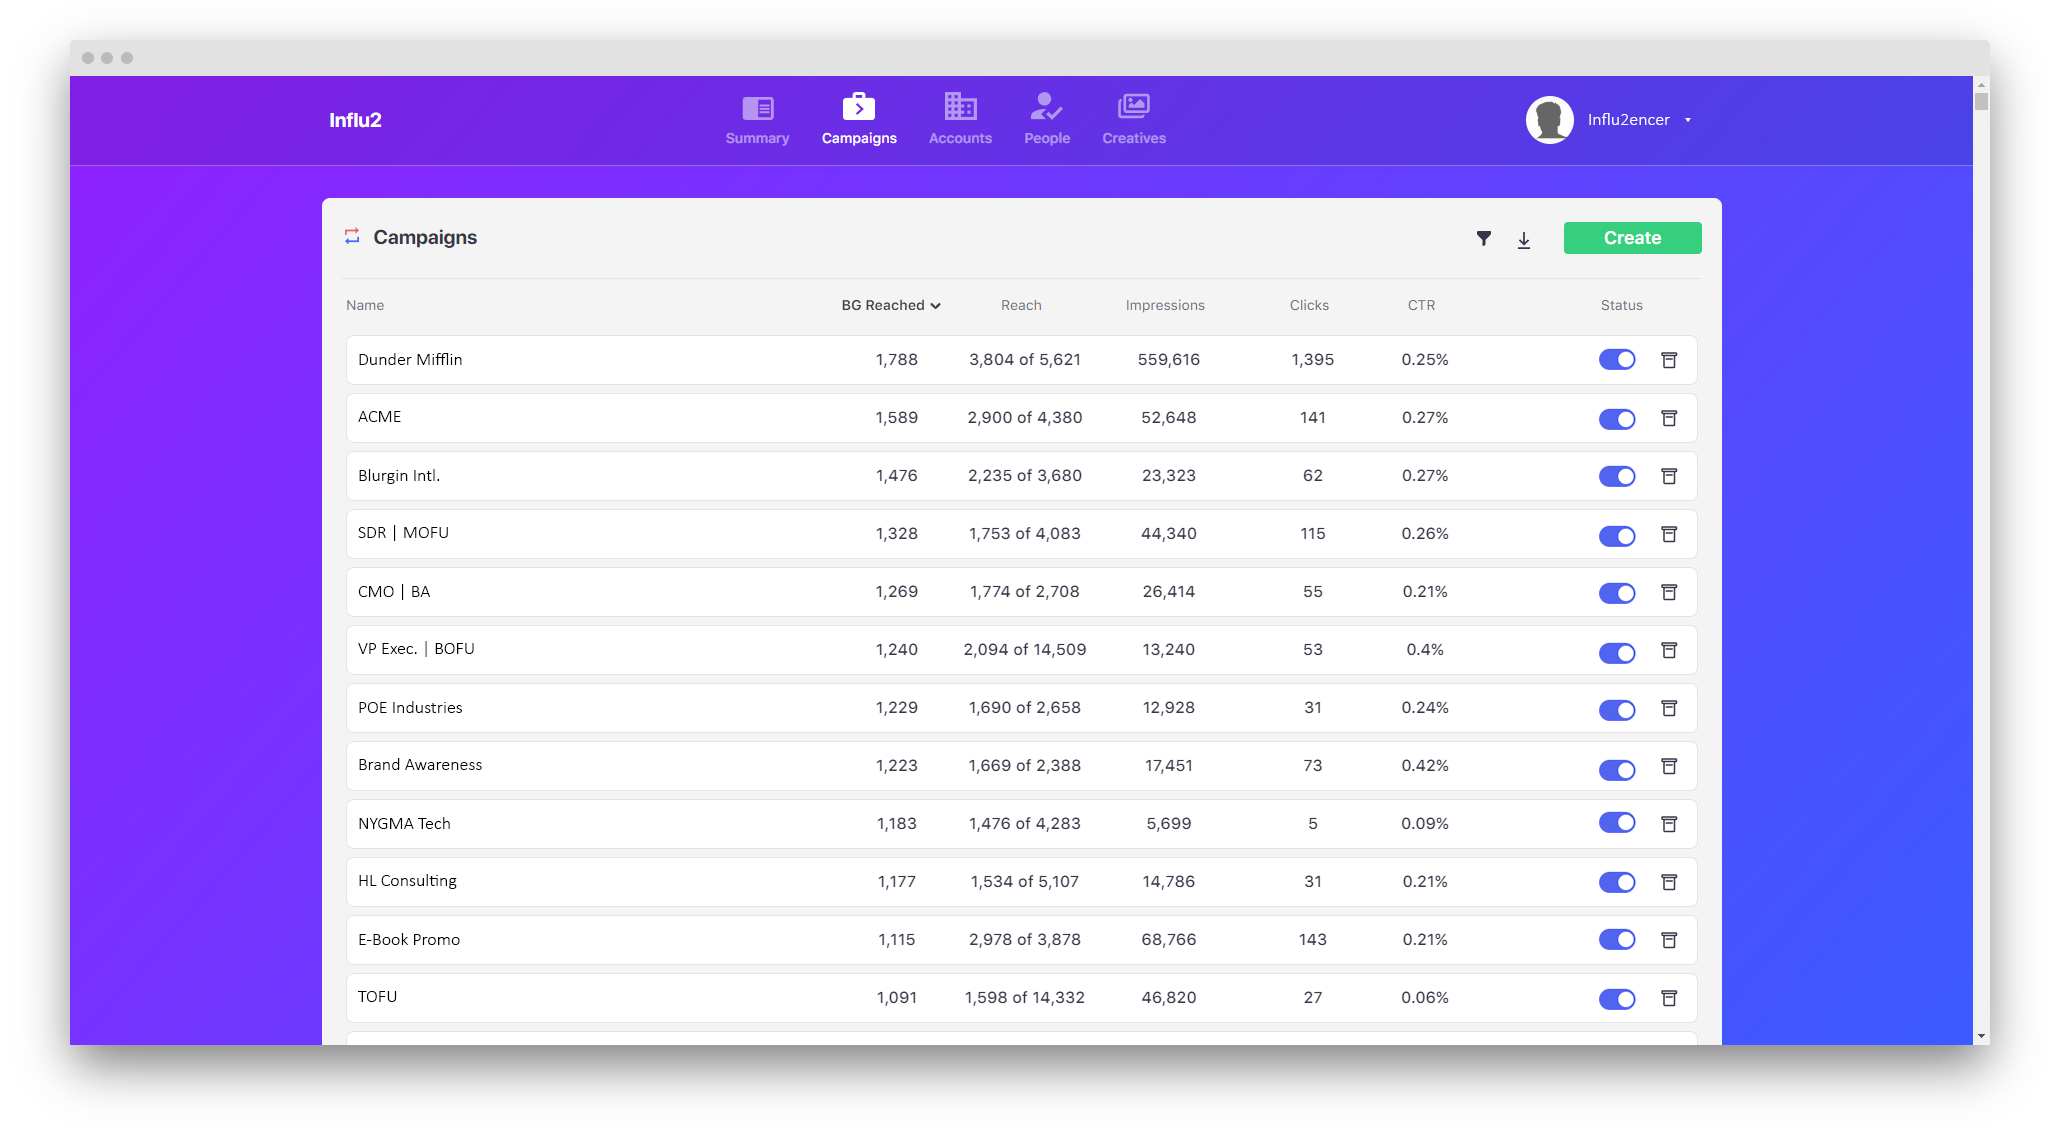
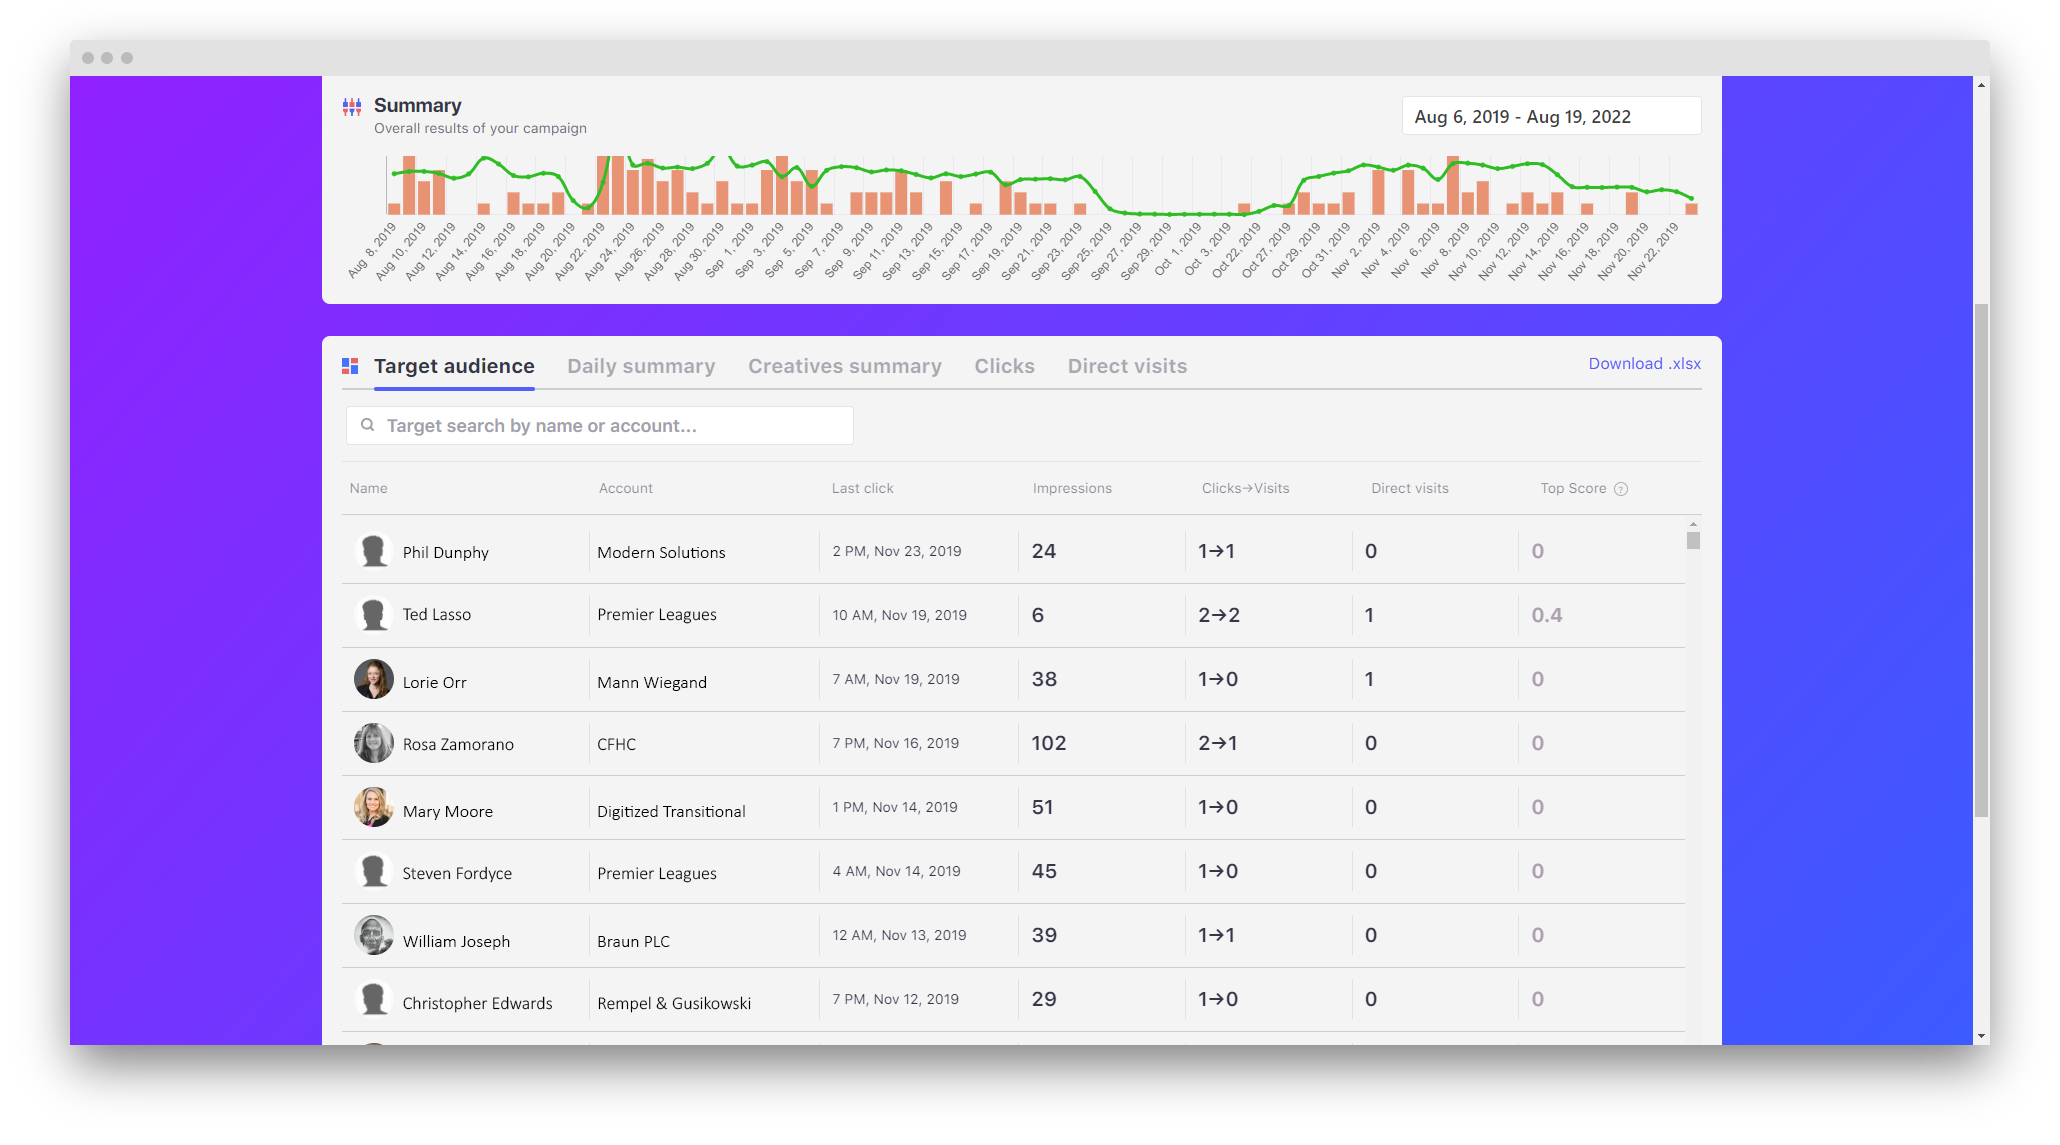
2. Once selected, a new tab will open for your campaign report overview. On the top, you'll see all impressions, clicks, contacts reached, and buying groups reached. Below the metrics is a graph for you to see real-time metrics of your campaign.
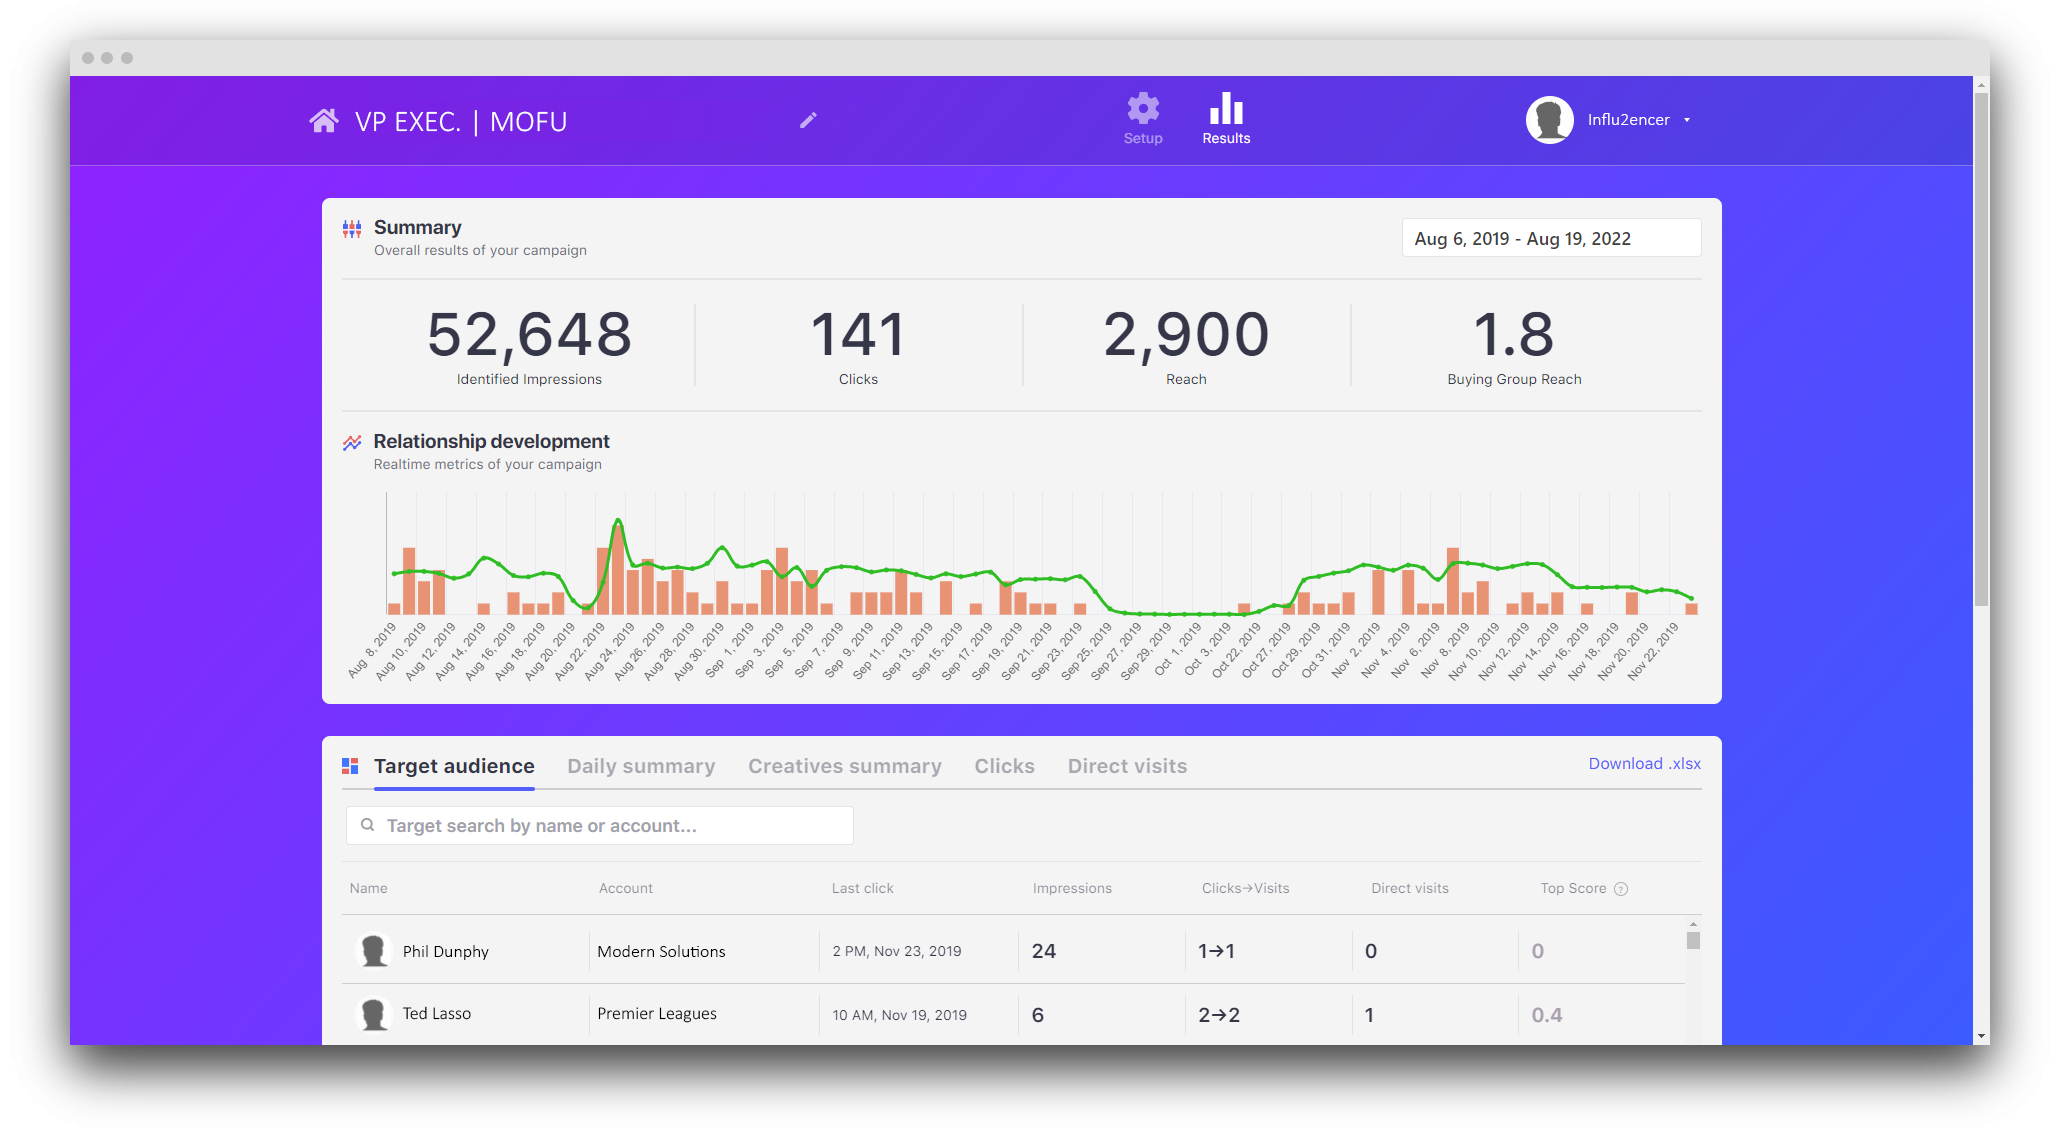
3. Scrolling down, you can see the following tabs:
- Target audience - Reached contacts targeted in this campaign.
- Daily summary - The number of impressions, clicks and visits each day from this campaign.
- Creatives summary - All ad creatives within this campaign.
- Clicks - Shows the date, time, person, account, creative, and more information of each click in the campaign.
- Direct visits - Exact contacts of the campaign that have visited your website, separate from clicking an ad.
Account reports
Account reports show a performance overview of a specific buying group. Let's go over what an account report looks like.
1. Go to your 'Accounts' tab. Then, select the name of an account you'd like to dig deeper into.
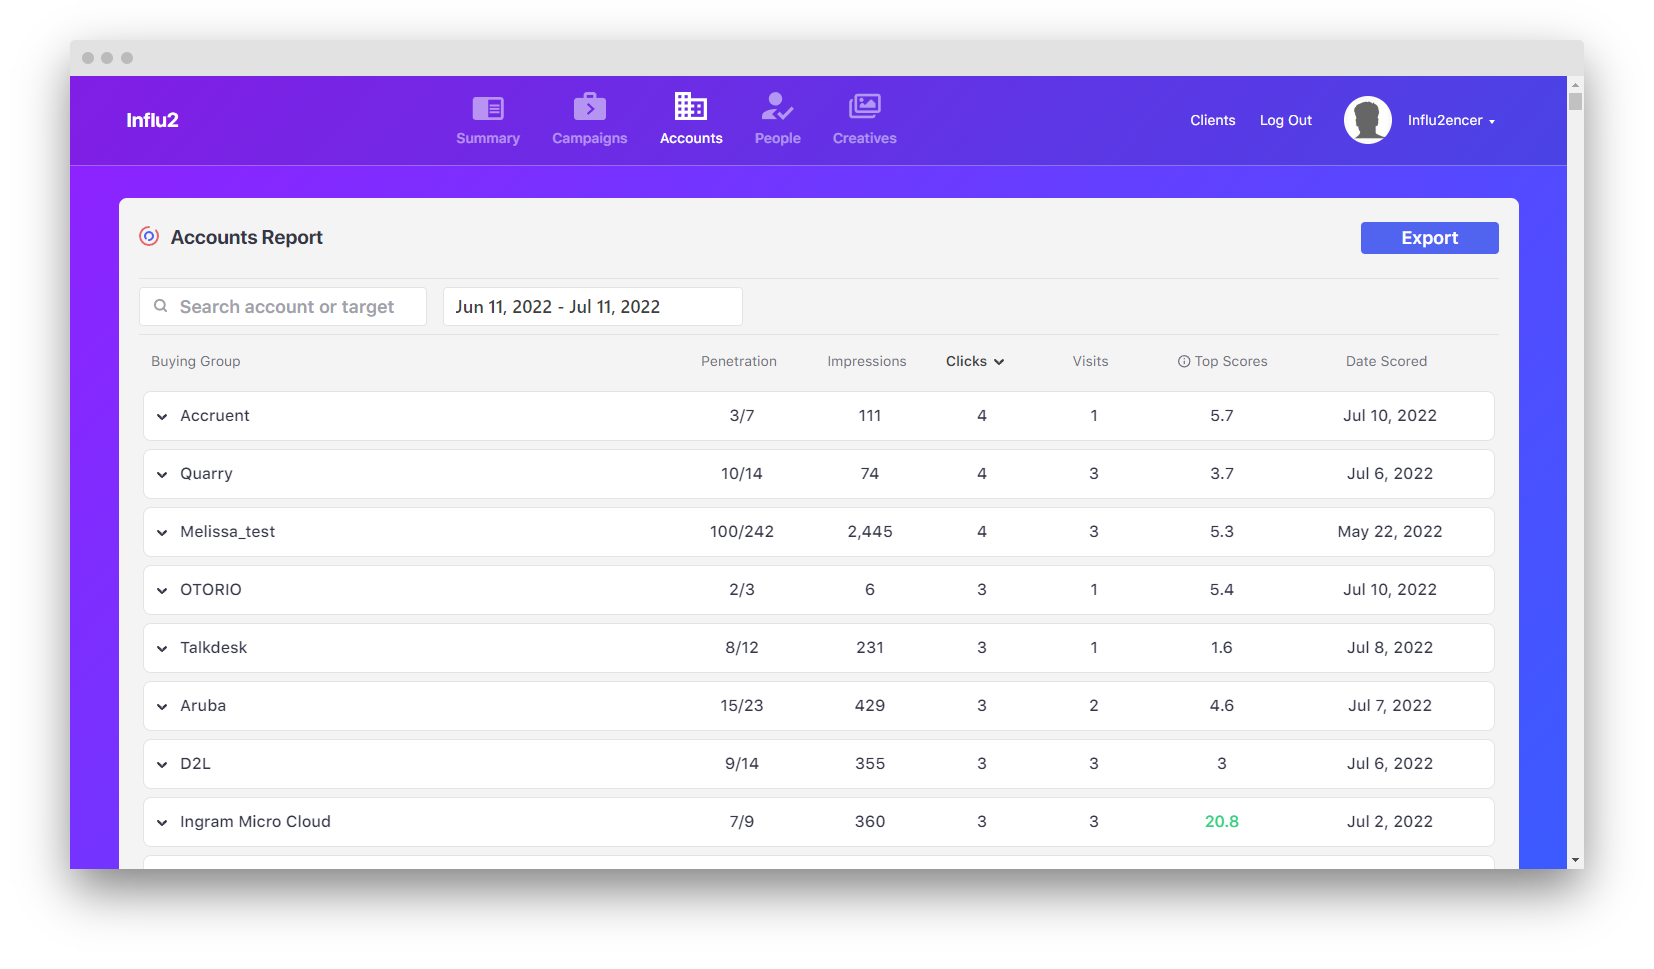
2. Once selected, a new tab will open for your account report overview. On the top, you'll see the name of the account with their BGE score.
Then, a 'Performance Summary' graph that can be edited by changing the date filter on the right. This graph shows all engagements the account has had.
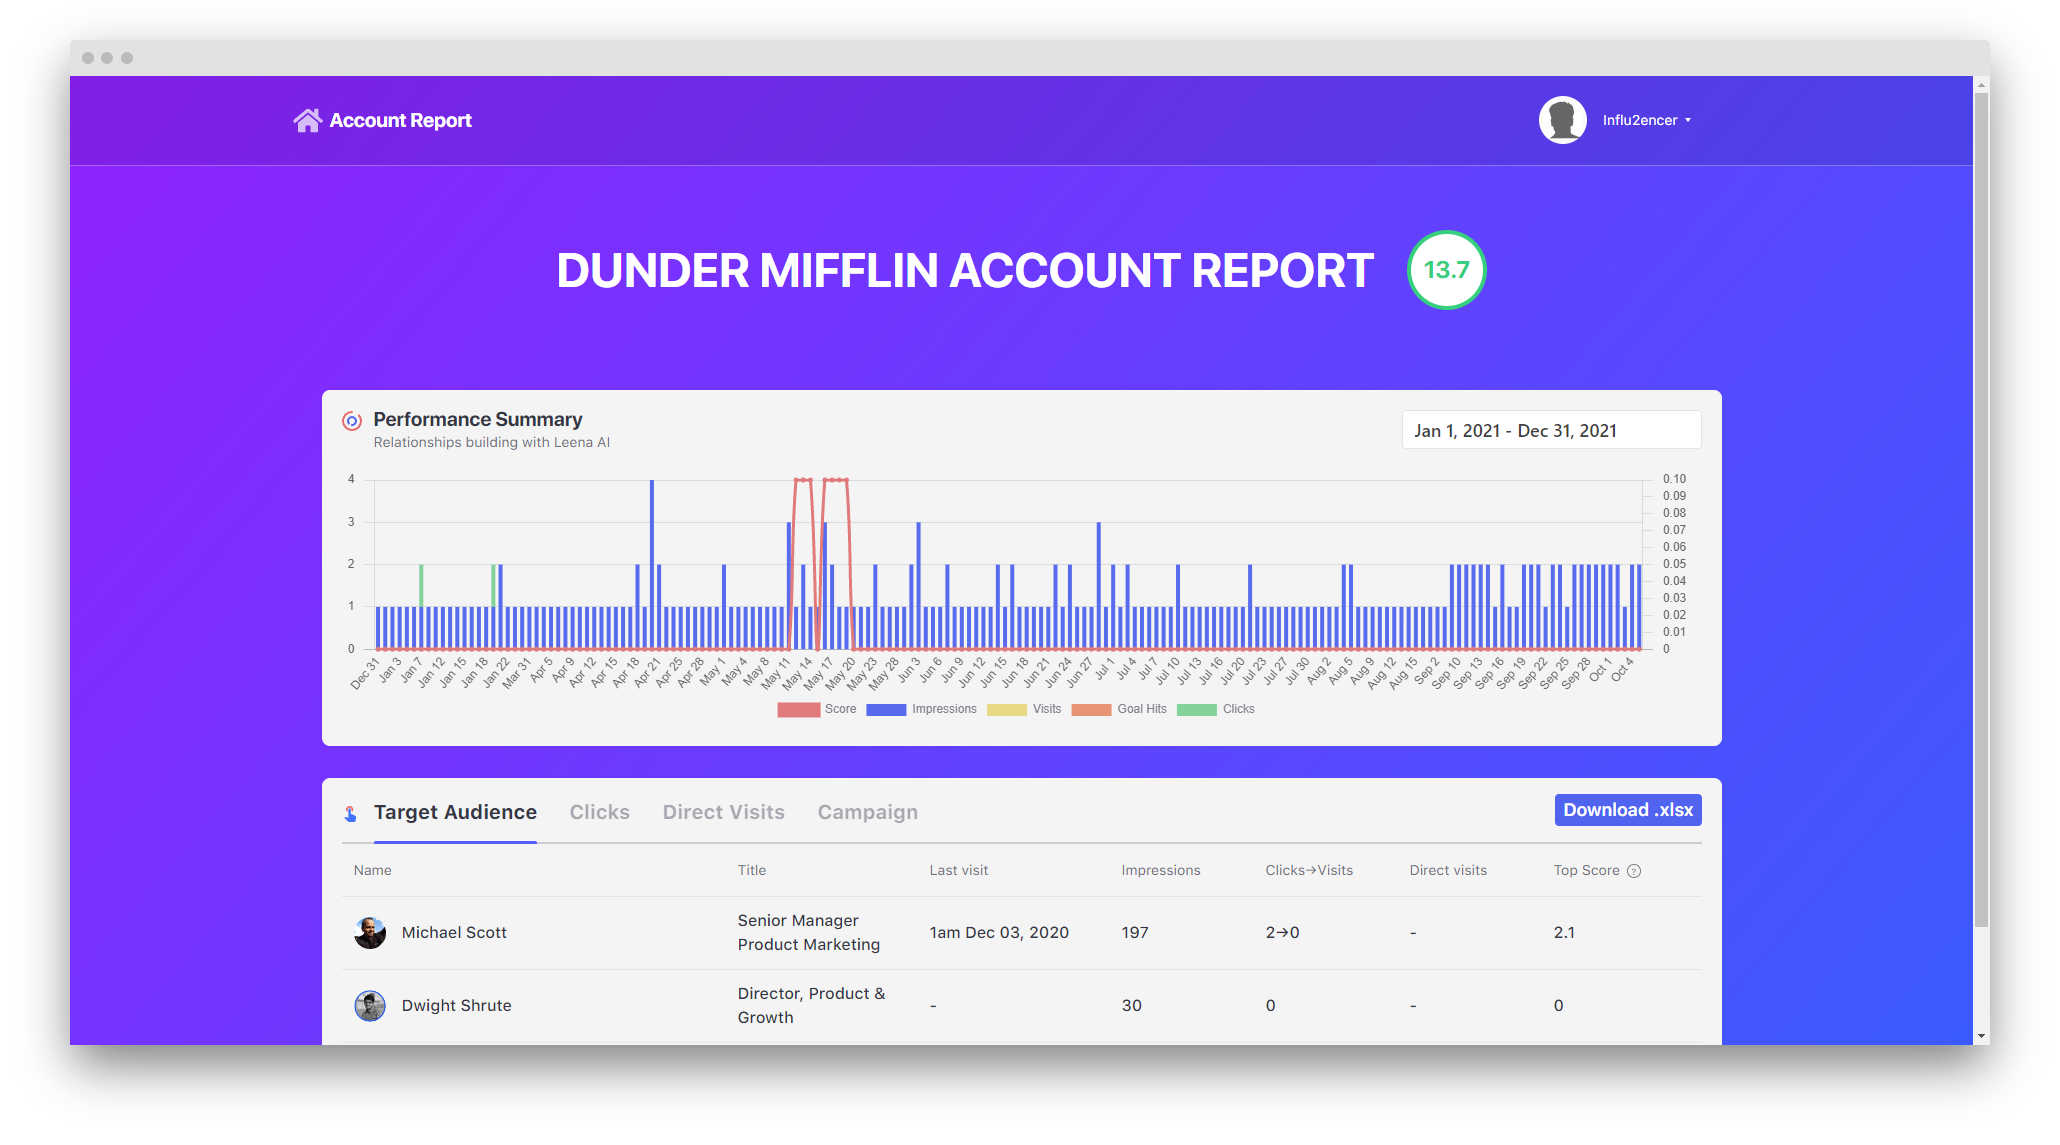
3. Scrolling down, you can see the following tabs:
- Target audience - Exact contacts targeted in this account.
- Clicks - Shows the date, time, person, creative, and more information of each click in the account.
- Direct visits - Exact contacts of the account that have visited your website separate from clicking an ad in a campaign.
- Campaign - Shows which contacts are in which campaigns you have created.
Personal reports
Personal reports show a performance overview of a specific contact. Let's go over what a personal report looks like.
1. Go to your 'People' tab. Then, select the name of a contact you'd like to dig deeper into. You can also access a personal report by finding a contact through a campaign report, an account report, or the summary page.
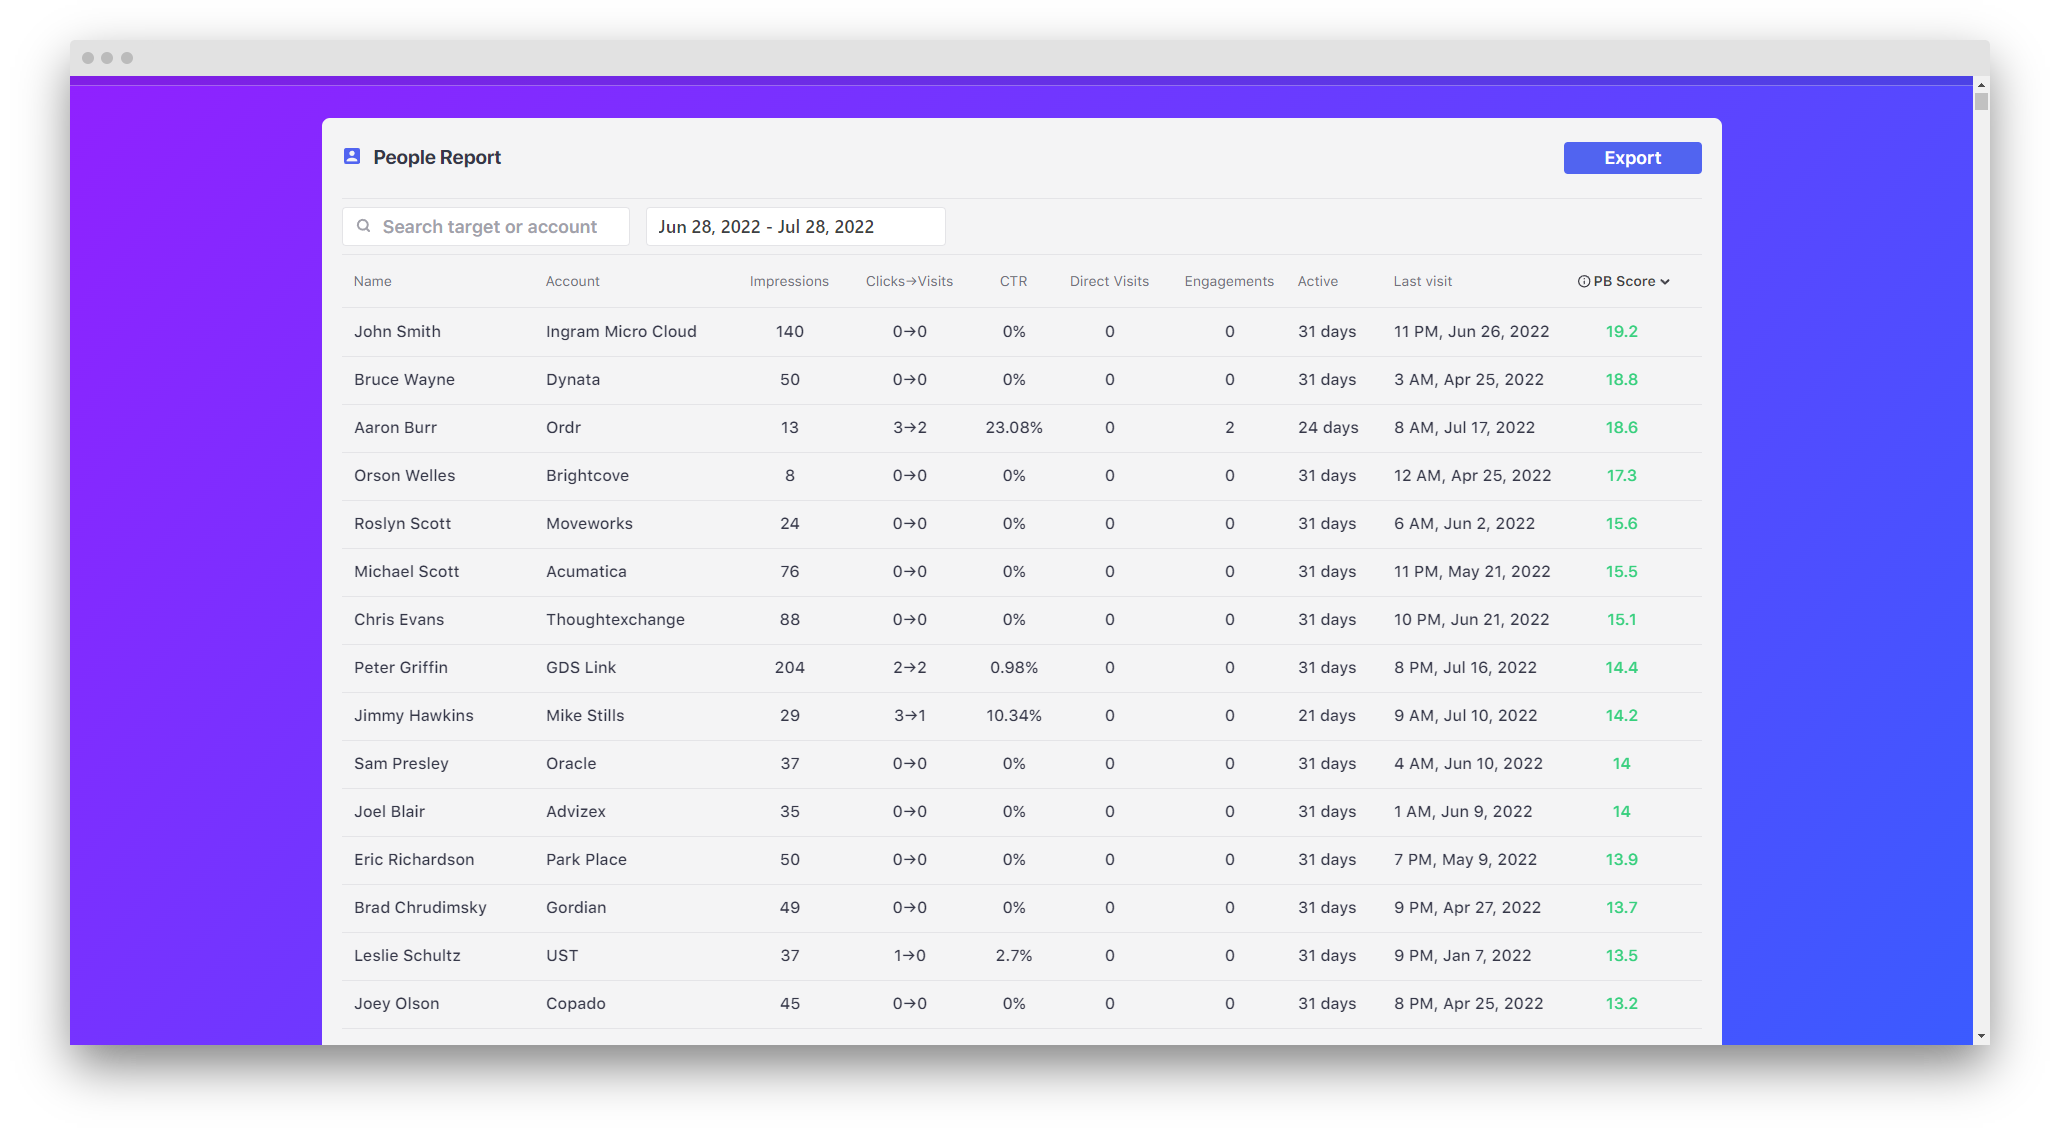
2. Once selected, a new tab will open for your personal report overview. On the top, you'll see the name of your contact with some basic information. This will also show the PB score of this contact.
Then, a 'Performance Summary' graph that can be edited by changing the date filter on the right. This graph shows all engagements the contact has had.
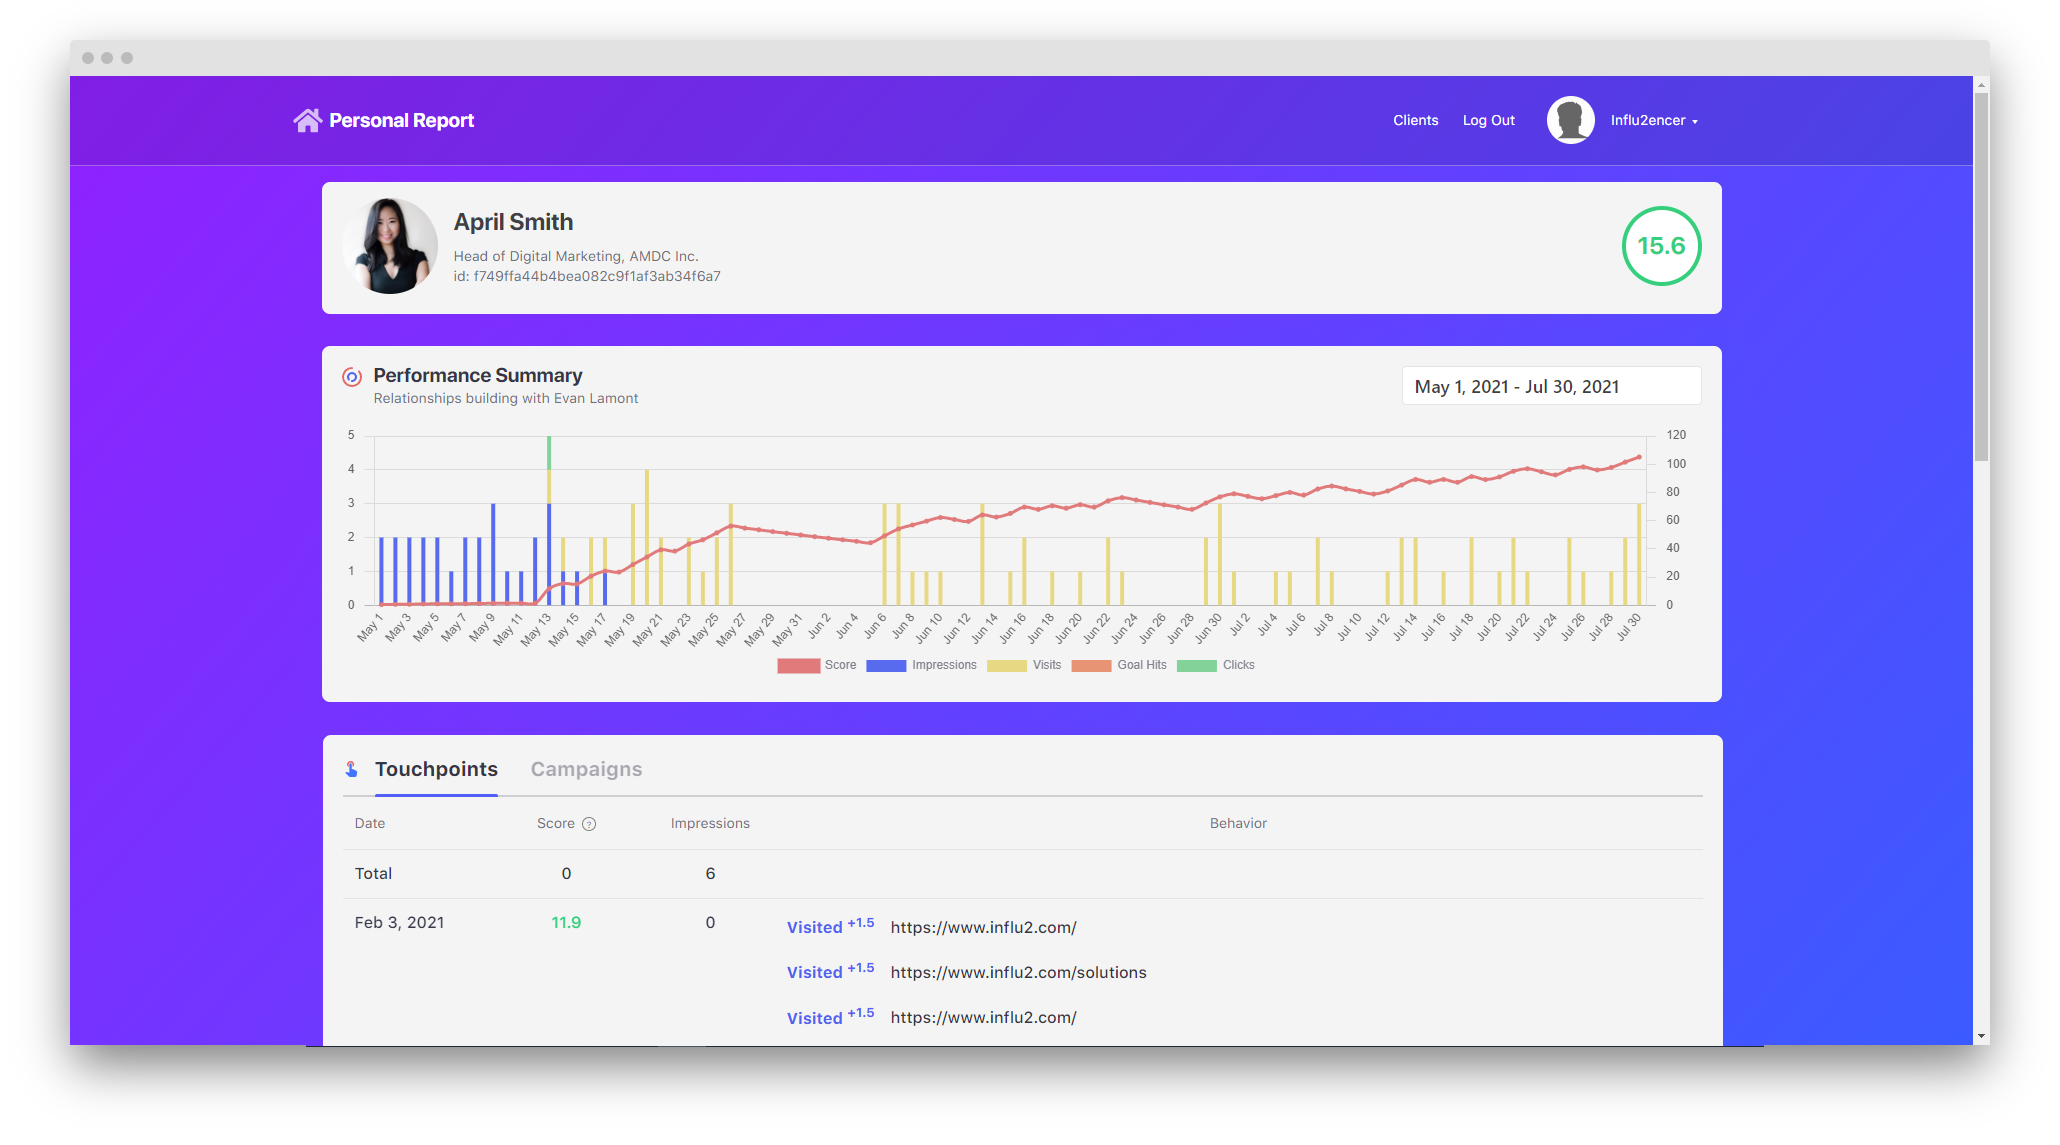
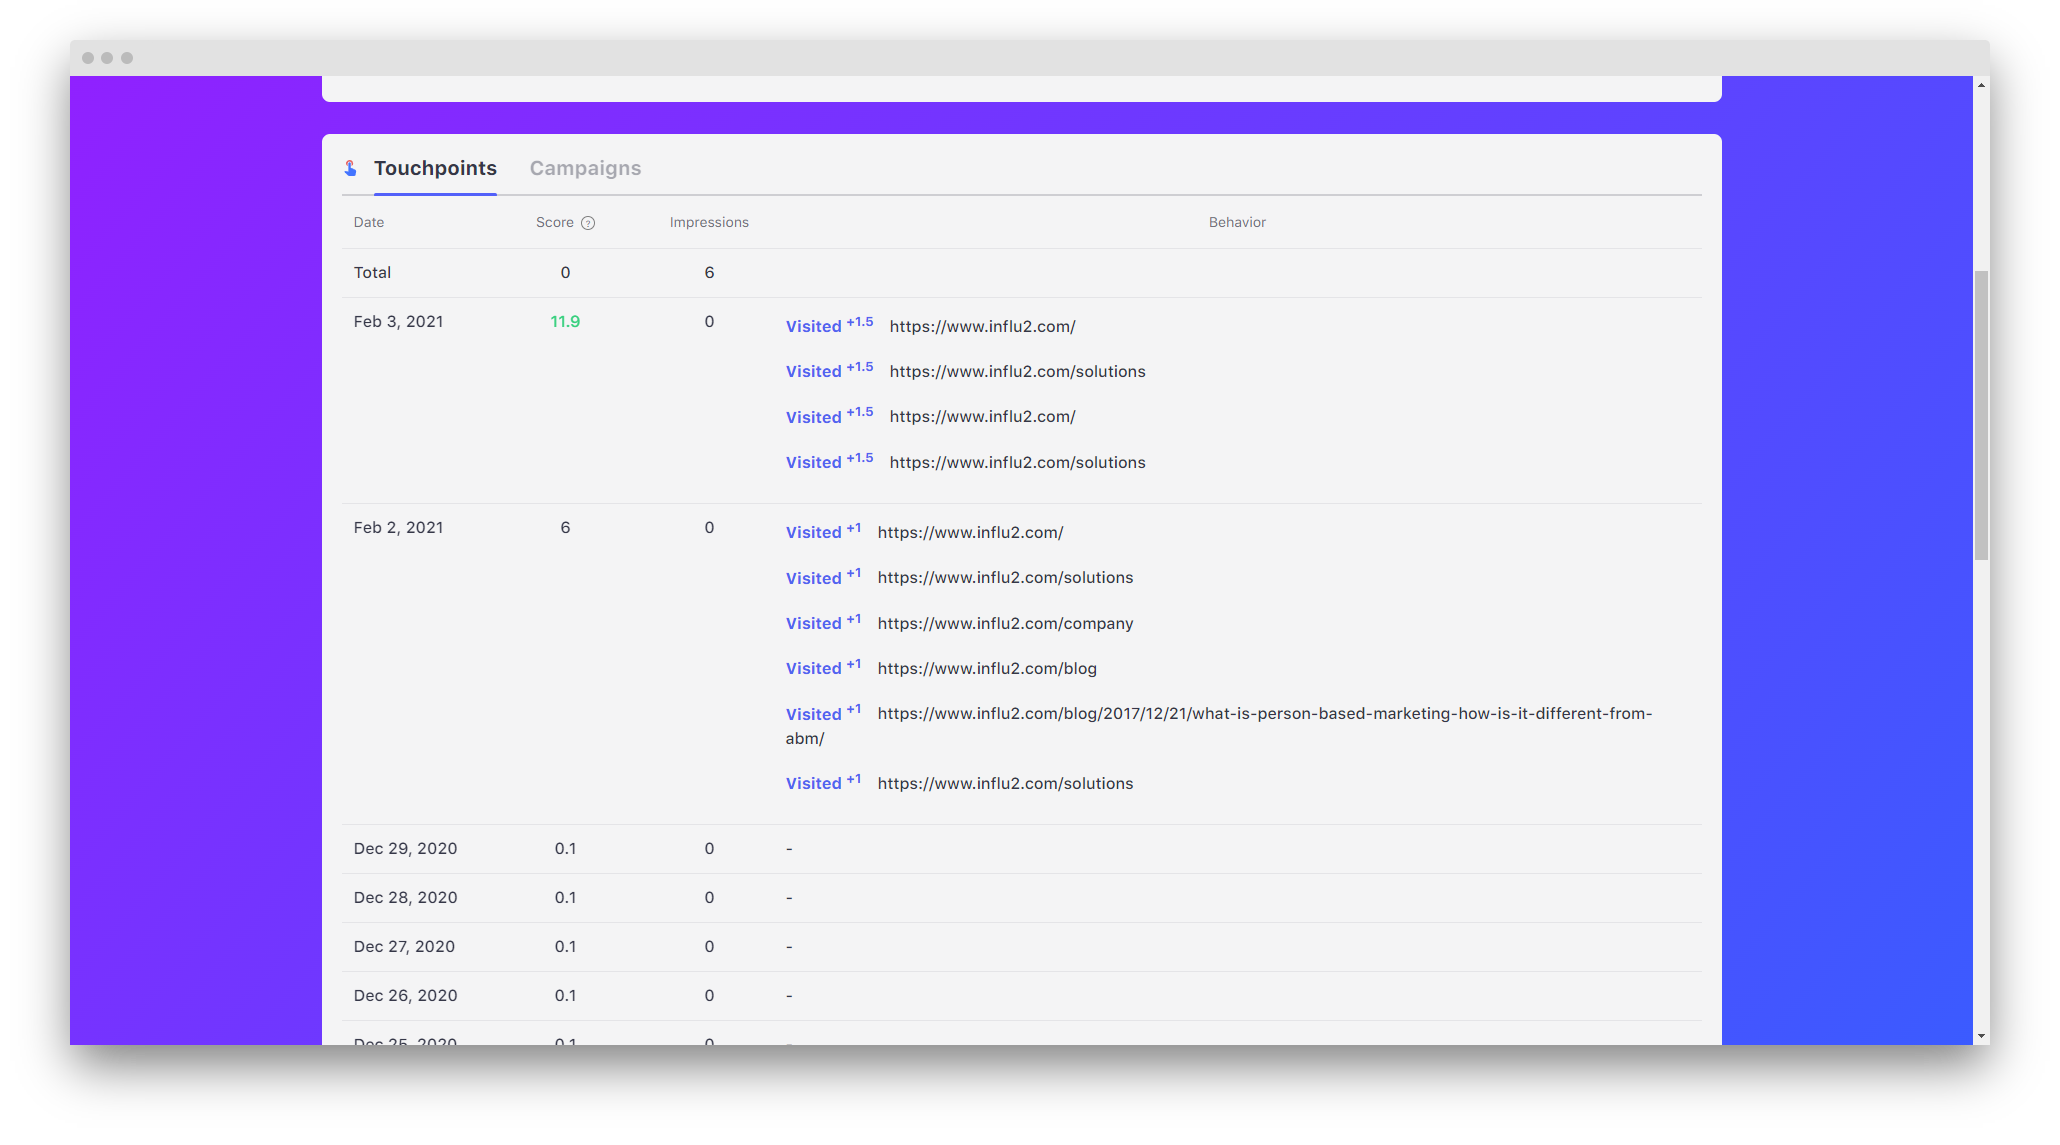
3. Scrolling down, you can see the following tabs:
- Touchpoints - Shows the score, impressions, and behavior of the contact each day.
- Campaigns - Shows which campaigns this contact is part of.
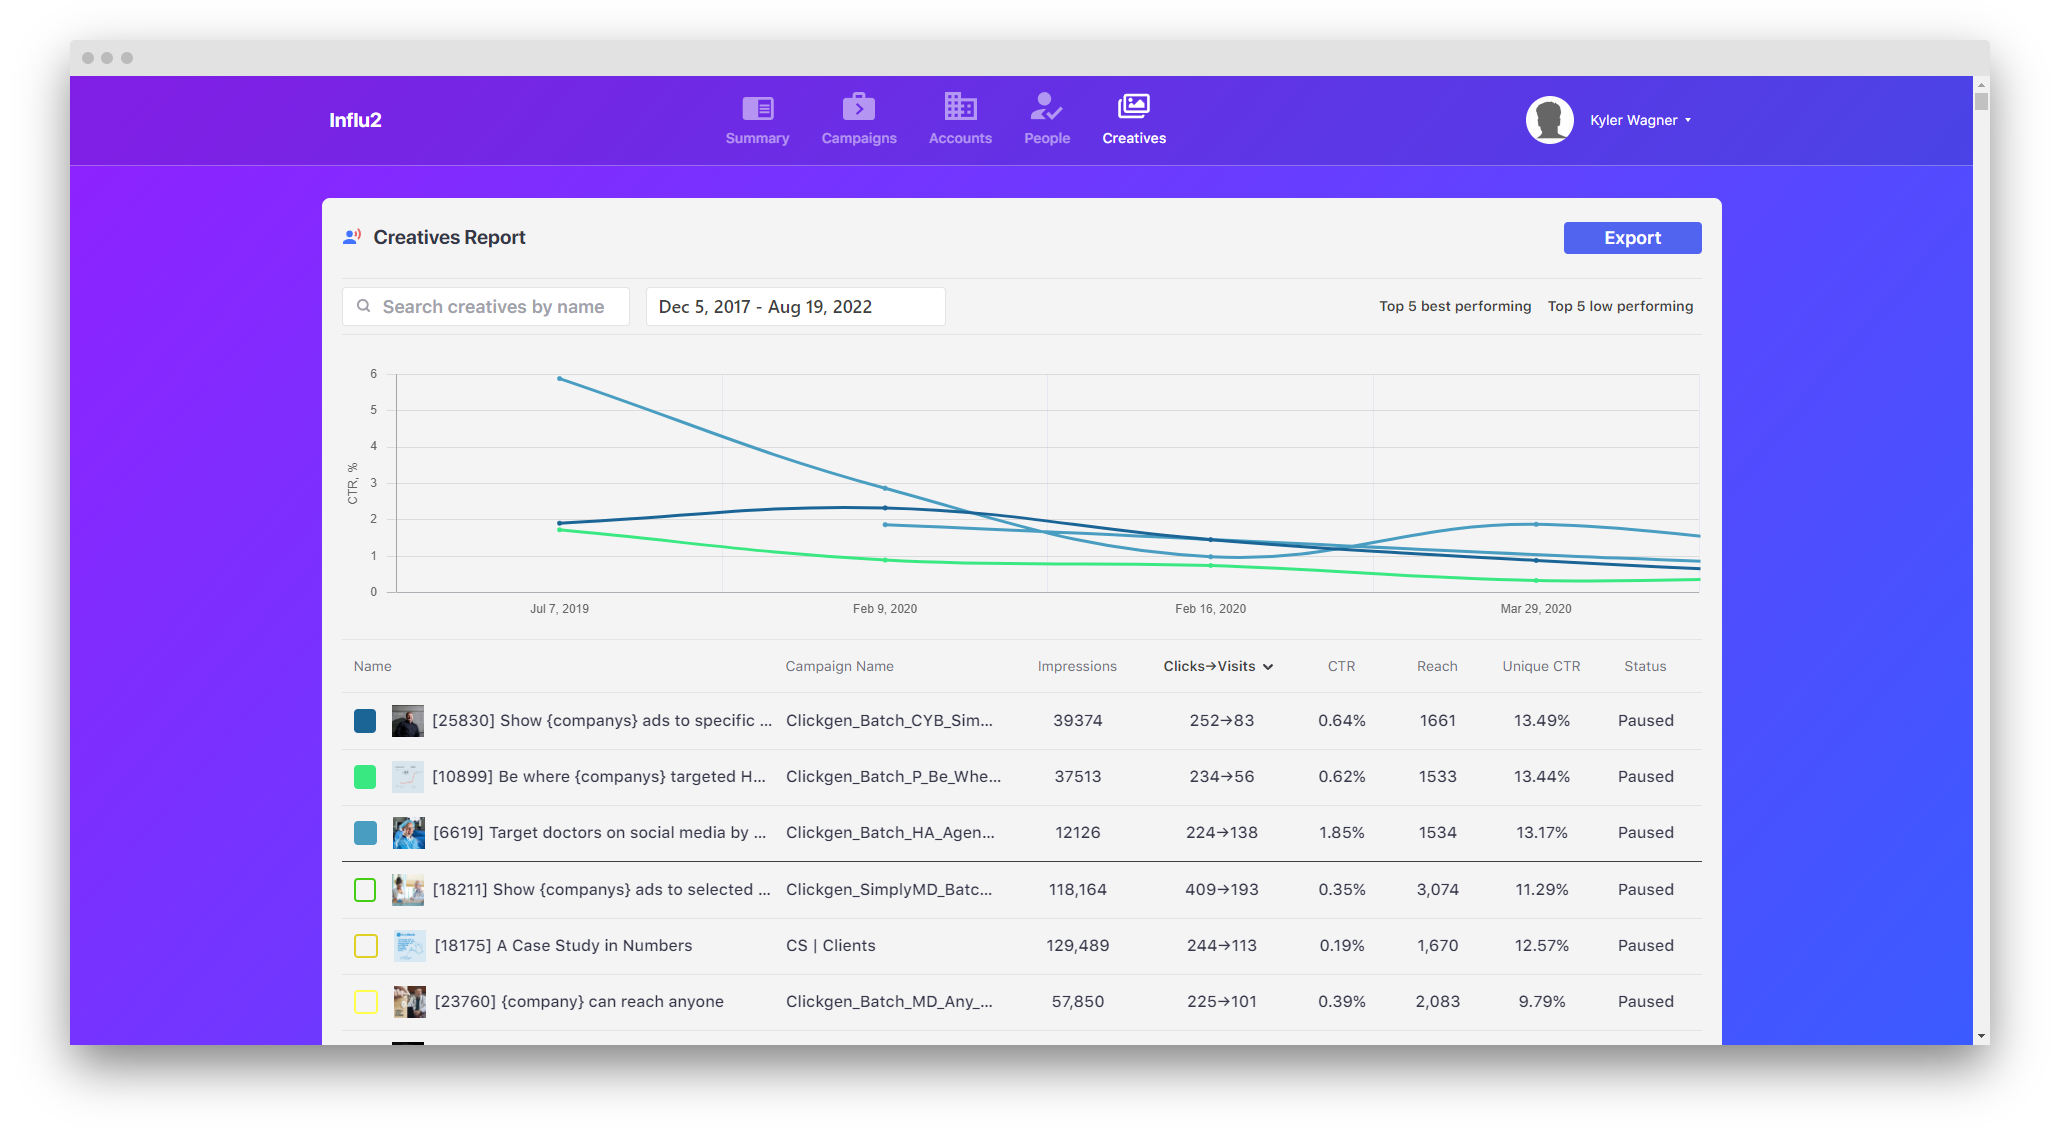
Creative reports
Creative reports show a performance overview of a specific piece of creative. Let's go over what a creative report looks like.
1. Go to your 'Creative' tab. Then, select the name of a creative you'd like to dig deeper into. You can also access a creative report through a campaign or account report.
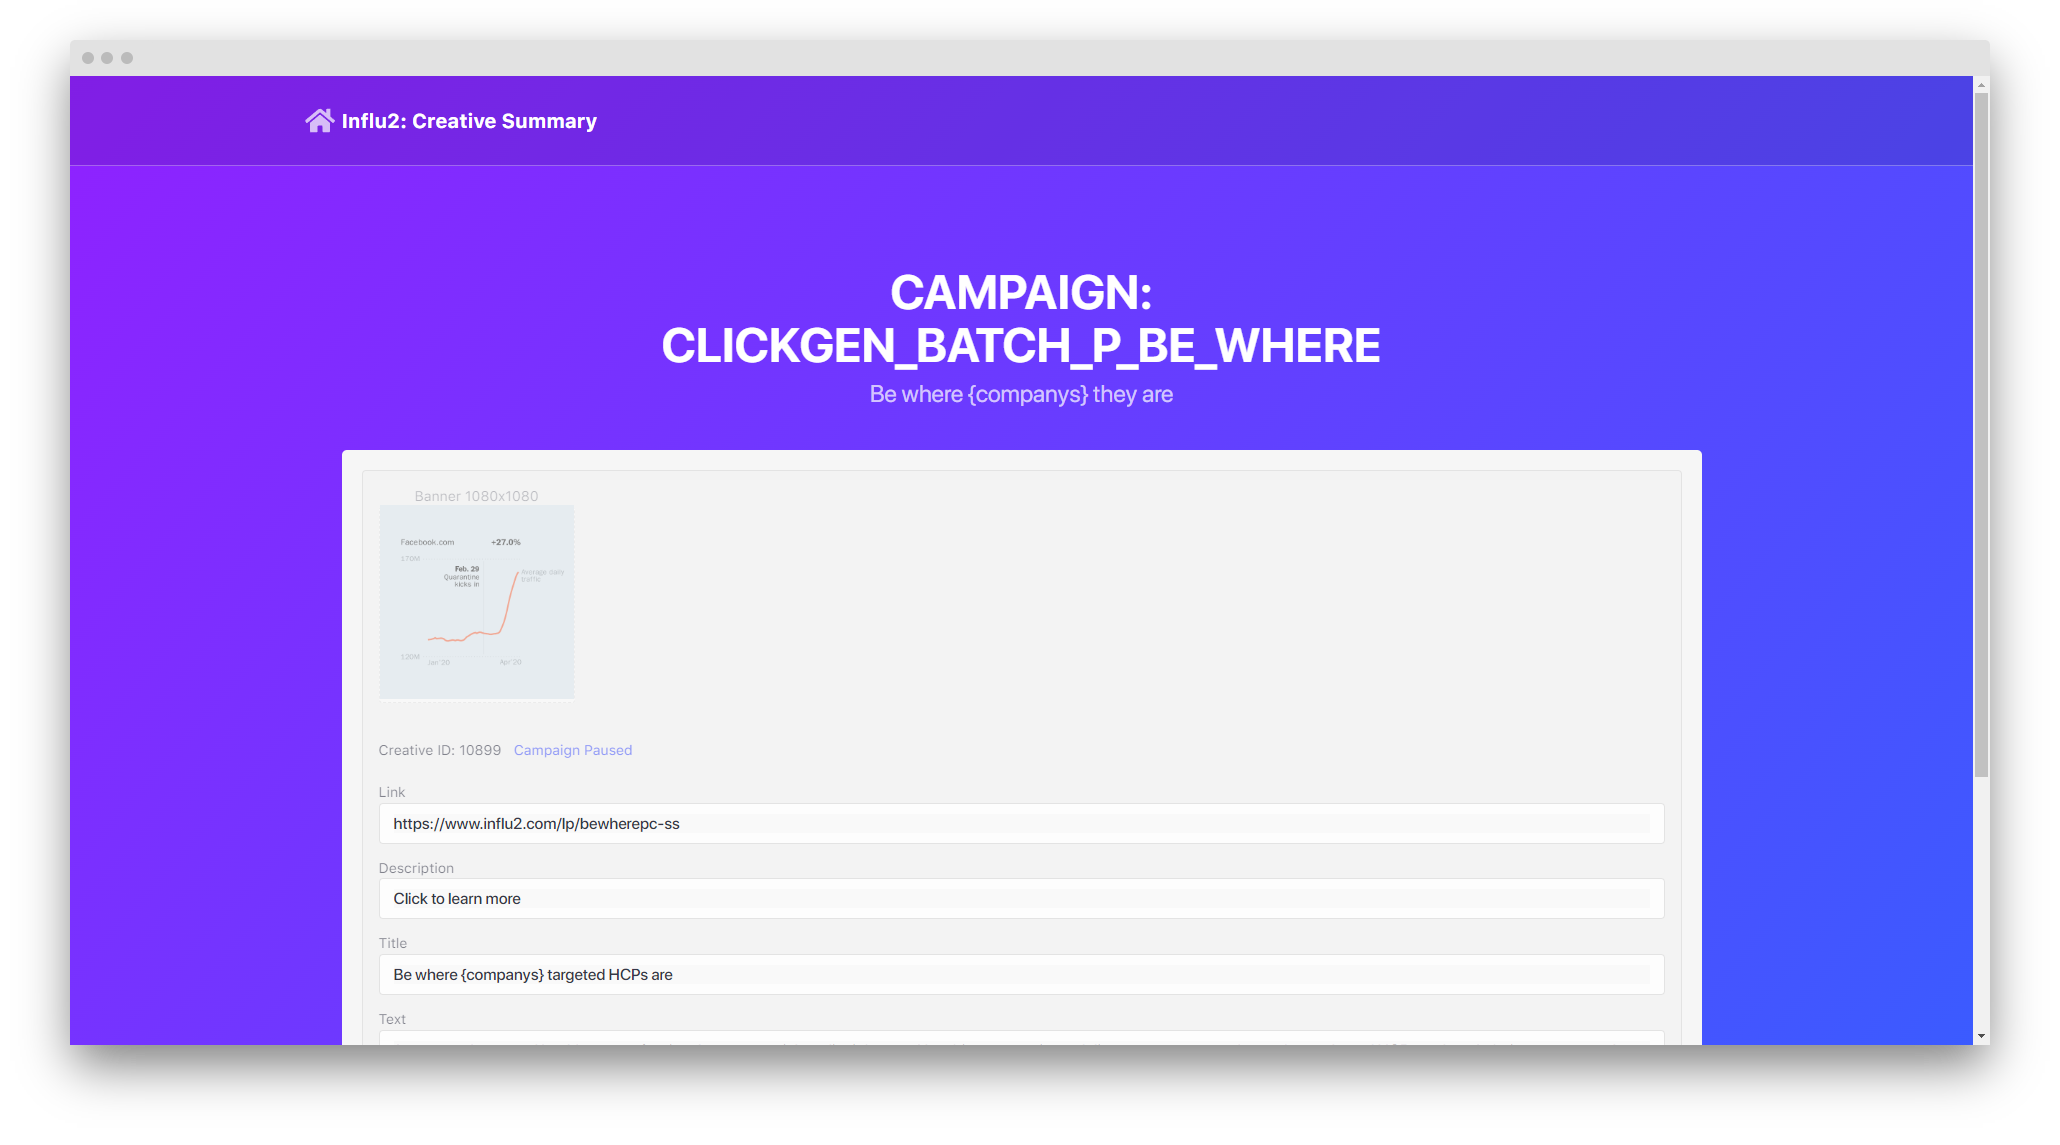
2. Once selected, a new tab will open for your creative report overview. On the top, you'll see the creative with the following information of the ad:
- Link
- Description
- Title
- Text
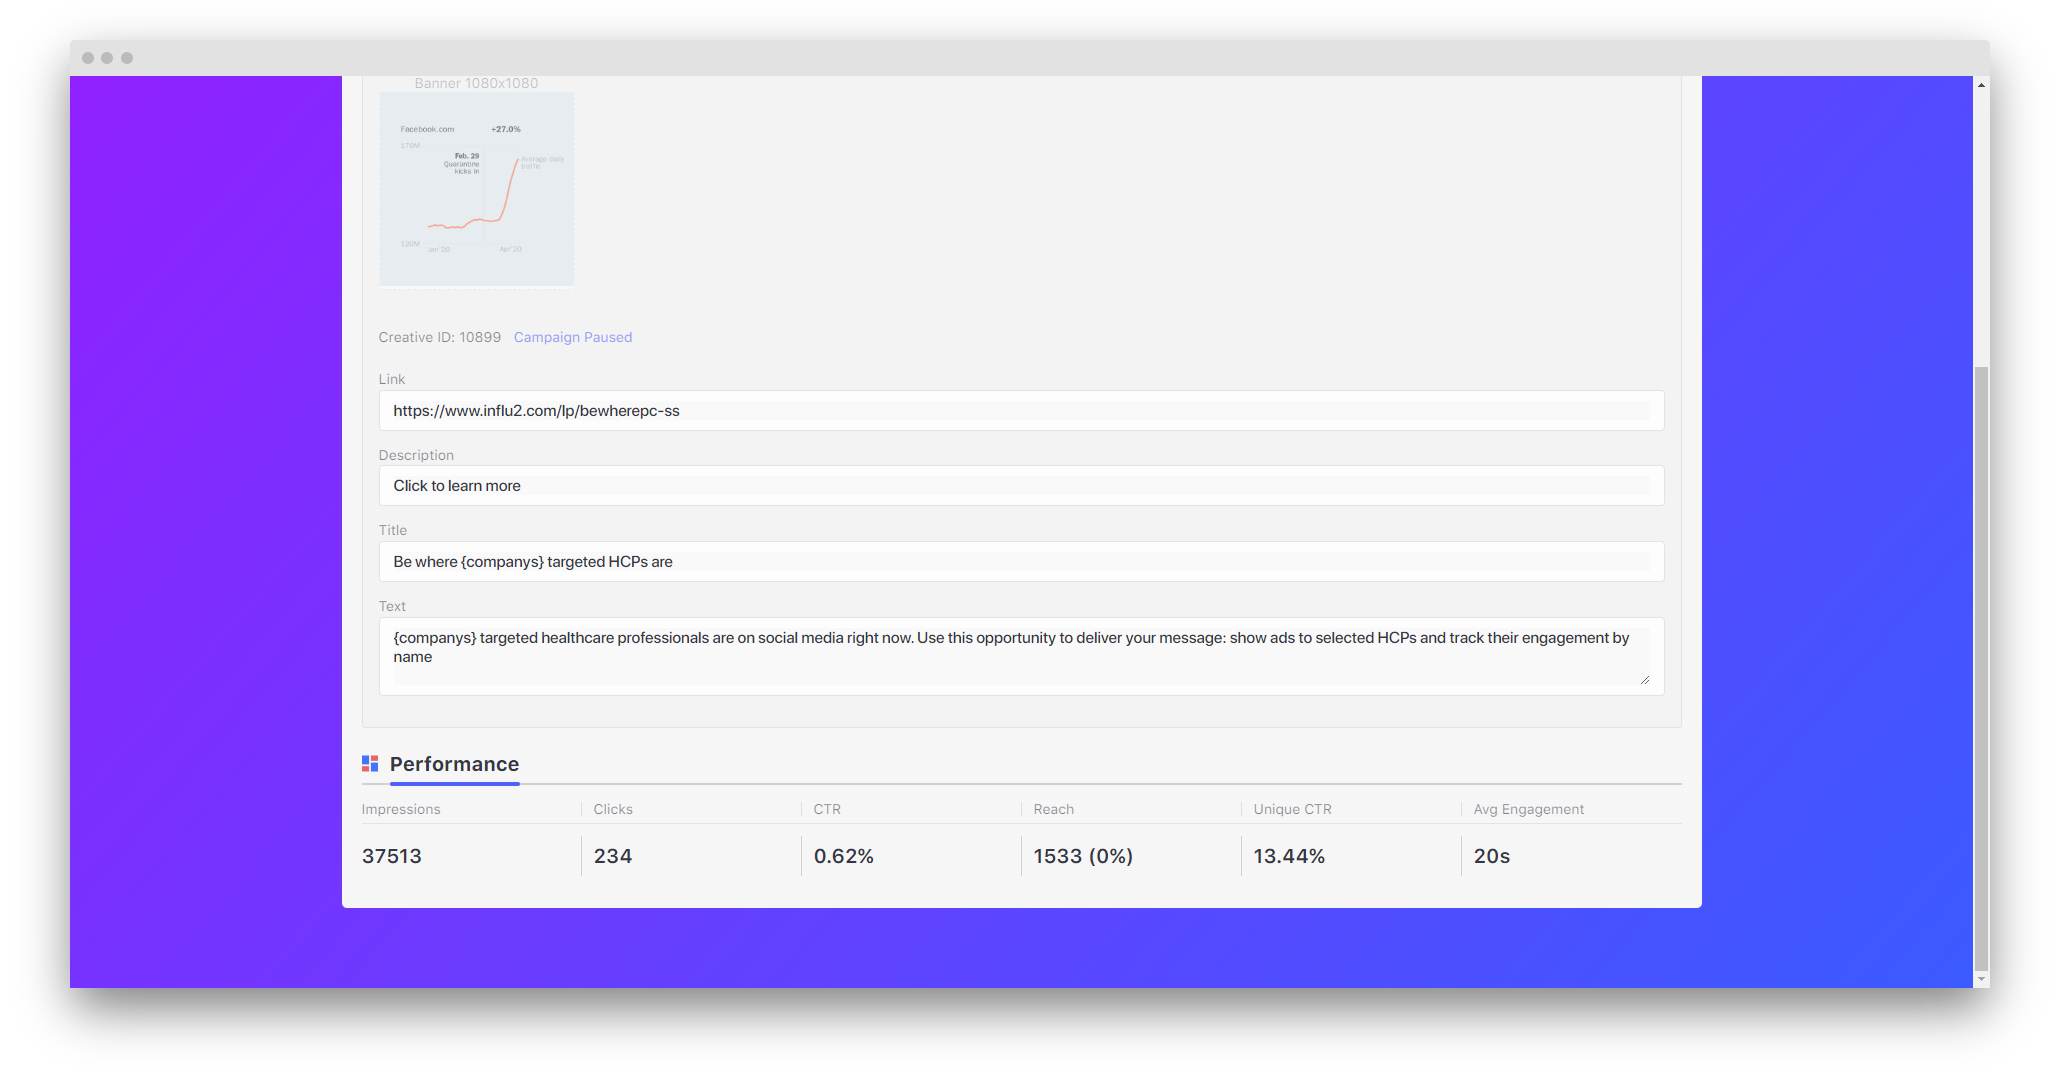
3. Scrolling down, you can see the following tab:
- Performance - Shows all impressions, clicks, CTR, reach, Unique CTR, and avg. engagement of this ad across all campaigns.
Comments
0 comments
Please sign in to leave a comment.